
Fast Frequency Response Potential of Data Centers Through Workload Modulation and UPS Coordination
IEEE Access (Institute of Electrical and Electronics Engineers (IEEE)) · Xiaojie Tao, Rajit Gadh
A 20 MW data centre added to the IEEE 39-bus system uses two fast frequency-response channels, droop-controlled UPS battery discharge and IT-server power reduction through CPU throttling, to raise the frequency nadir after a 200 MW generator trip.
CC BY 4.0 — share with attribution
On this page
Overview
The study asks whether data centres can help stabilise frequency in low-inertia systems thanks to controllable IT workloads and on-site UPS systems. A dynamic model combining data-centre power consumption and grid frequency dynamics was developed; frequency-deviation control strategies adjust server power and discharge UPS batteries during frequency events. The 20 MW data centre is integrated at Bus 18 in Area 1 of the IEEE 39-bus system.
Model parameters: server droop gain 10 MW/Hz, UPS droop gain 15 MW/Hz (aggregate 25 MW/Hz), UPS energy 5 MWh, response time constant 0.1 s, discharge/charge efficiency 0.95/0.9, PUE 1.2, deadband ±0.03 Hz. The authors state UPS response time is typically below 100 ms. After a 200 MW generation trip (H = 2 s), the nadir was 59.66 Hz with no data-centre response, 59.78 Hz with UPS only and 59.85 Hz with coordinated UPS + IT response; recovery was about 1.6 s faster.
In the coordinated case the UPS discharged up to +8 MW within 0.2 s while IT throttling cut 4 MW; measured total response latency was 0.15 s. The coordinated strategy cut nadir deviation by 57% and recovery time by 34%, with task delay below 2%. The paper says UPS batteries can sustain multiple FFR activations per hour without compromising backup if SOC is kept within 20-80%.
Limits: the model is idealised (a first-order data-centre block) and some reported energy figures are inconsistent: the 1.65 MWh (33.3% of 5 MWh) discharged in the first 10 s does not match the stated ~8 MW peak discharge. Results rest on one disturbance scenario and one test system, with no validation on a real data centre.
Key points
- Model parameters: 20 MW data centre, server droop gain 10 MW/Hz, UPS droop gain 15 MW/Hz (aggregate 25 MW/Hz), UPS energy 5 MWh, response time constant 0.1 s, discharge/charge efficiency 0.95/0.9, PUE 1.2, deadband ±0.03 Hz.
- The authors state UPS response time is typically below 100 ms, suitable for the first stage of fast frequency response.
- After a 200 MW generation trip (H = 2 s), the nadir was 59.66 Hz with no response, 59.78 Hz with UPS only and 59.85 Hz with coordinated UPS + IT response; recovery was about 1.6 s faster.
- In the coordinated case the UPS discharged up to +8 MW within 0.2 s while IT throttling cut 4 MW; total response latency was 0.15 s.
- The coordinated strategy cut nadir deviation by 57% and recovery time by 34%, with task delay below 2%.
- The paper says UPS batteries can sustain multiple FFR activations per hour without compromising backup if SOC stays within 20-80%, but it also reports 1.65 MWh (33.3% of 5 MWh) discharged in the first 10 s, which does not match the stated ~8 MW peak.
Using it in design
- For a UPS that will provide grid services, define the SOC window (for example 20-80%) and show by calculation that backup autonomy is preserved inside it.
- Keep UPS droop and server throttling gains as separate control inputs, and verify response latency (0.15 s) and the task-delay limit (2%) together.
- Check that MW peak discharge and discharged MWh are consistent in your own energy budget, and do not repeat the inconsistency found in the paper.
Monthly newsletter · free
Keep your reading list current
Once a month: new library sources, changes to Turkish regulations and upcoming data centre events.
SoSo CAD
Review your power design in SoSo CAD
Inspect supply paths, equipment loads and UPS failure scenarios in one model.
Request a demo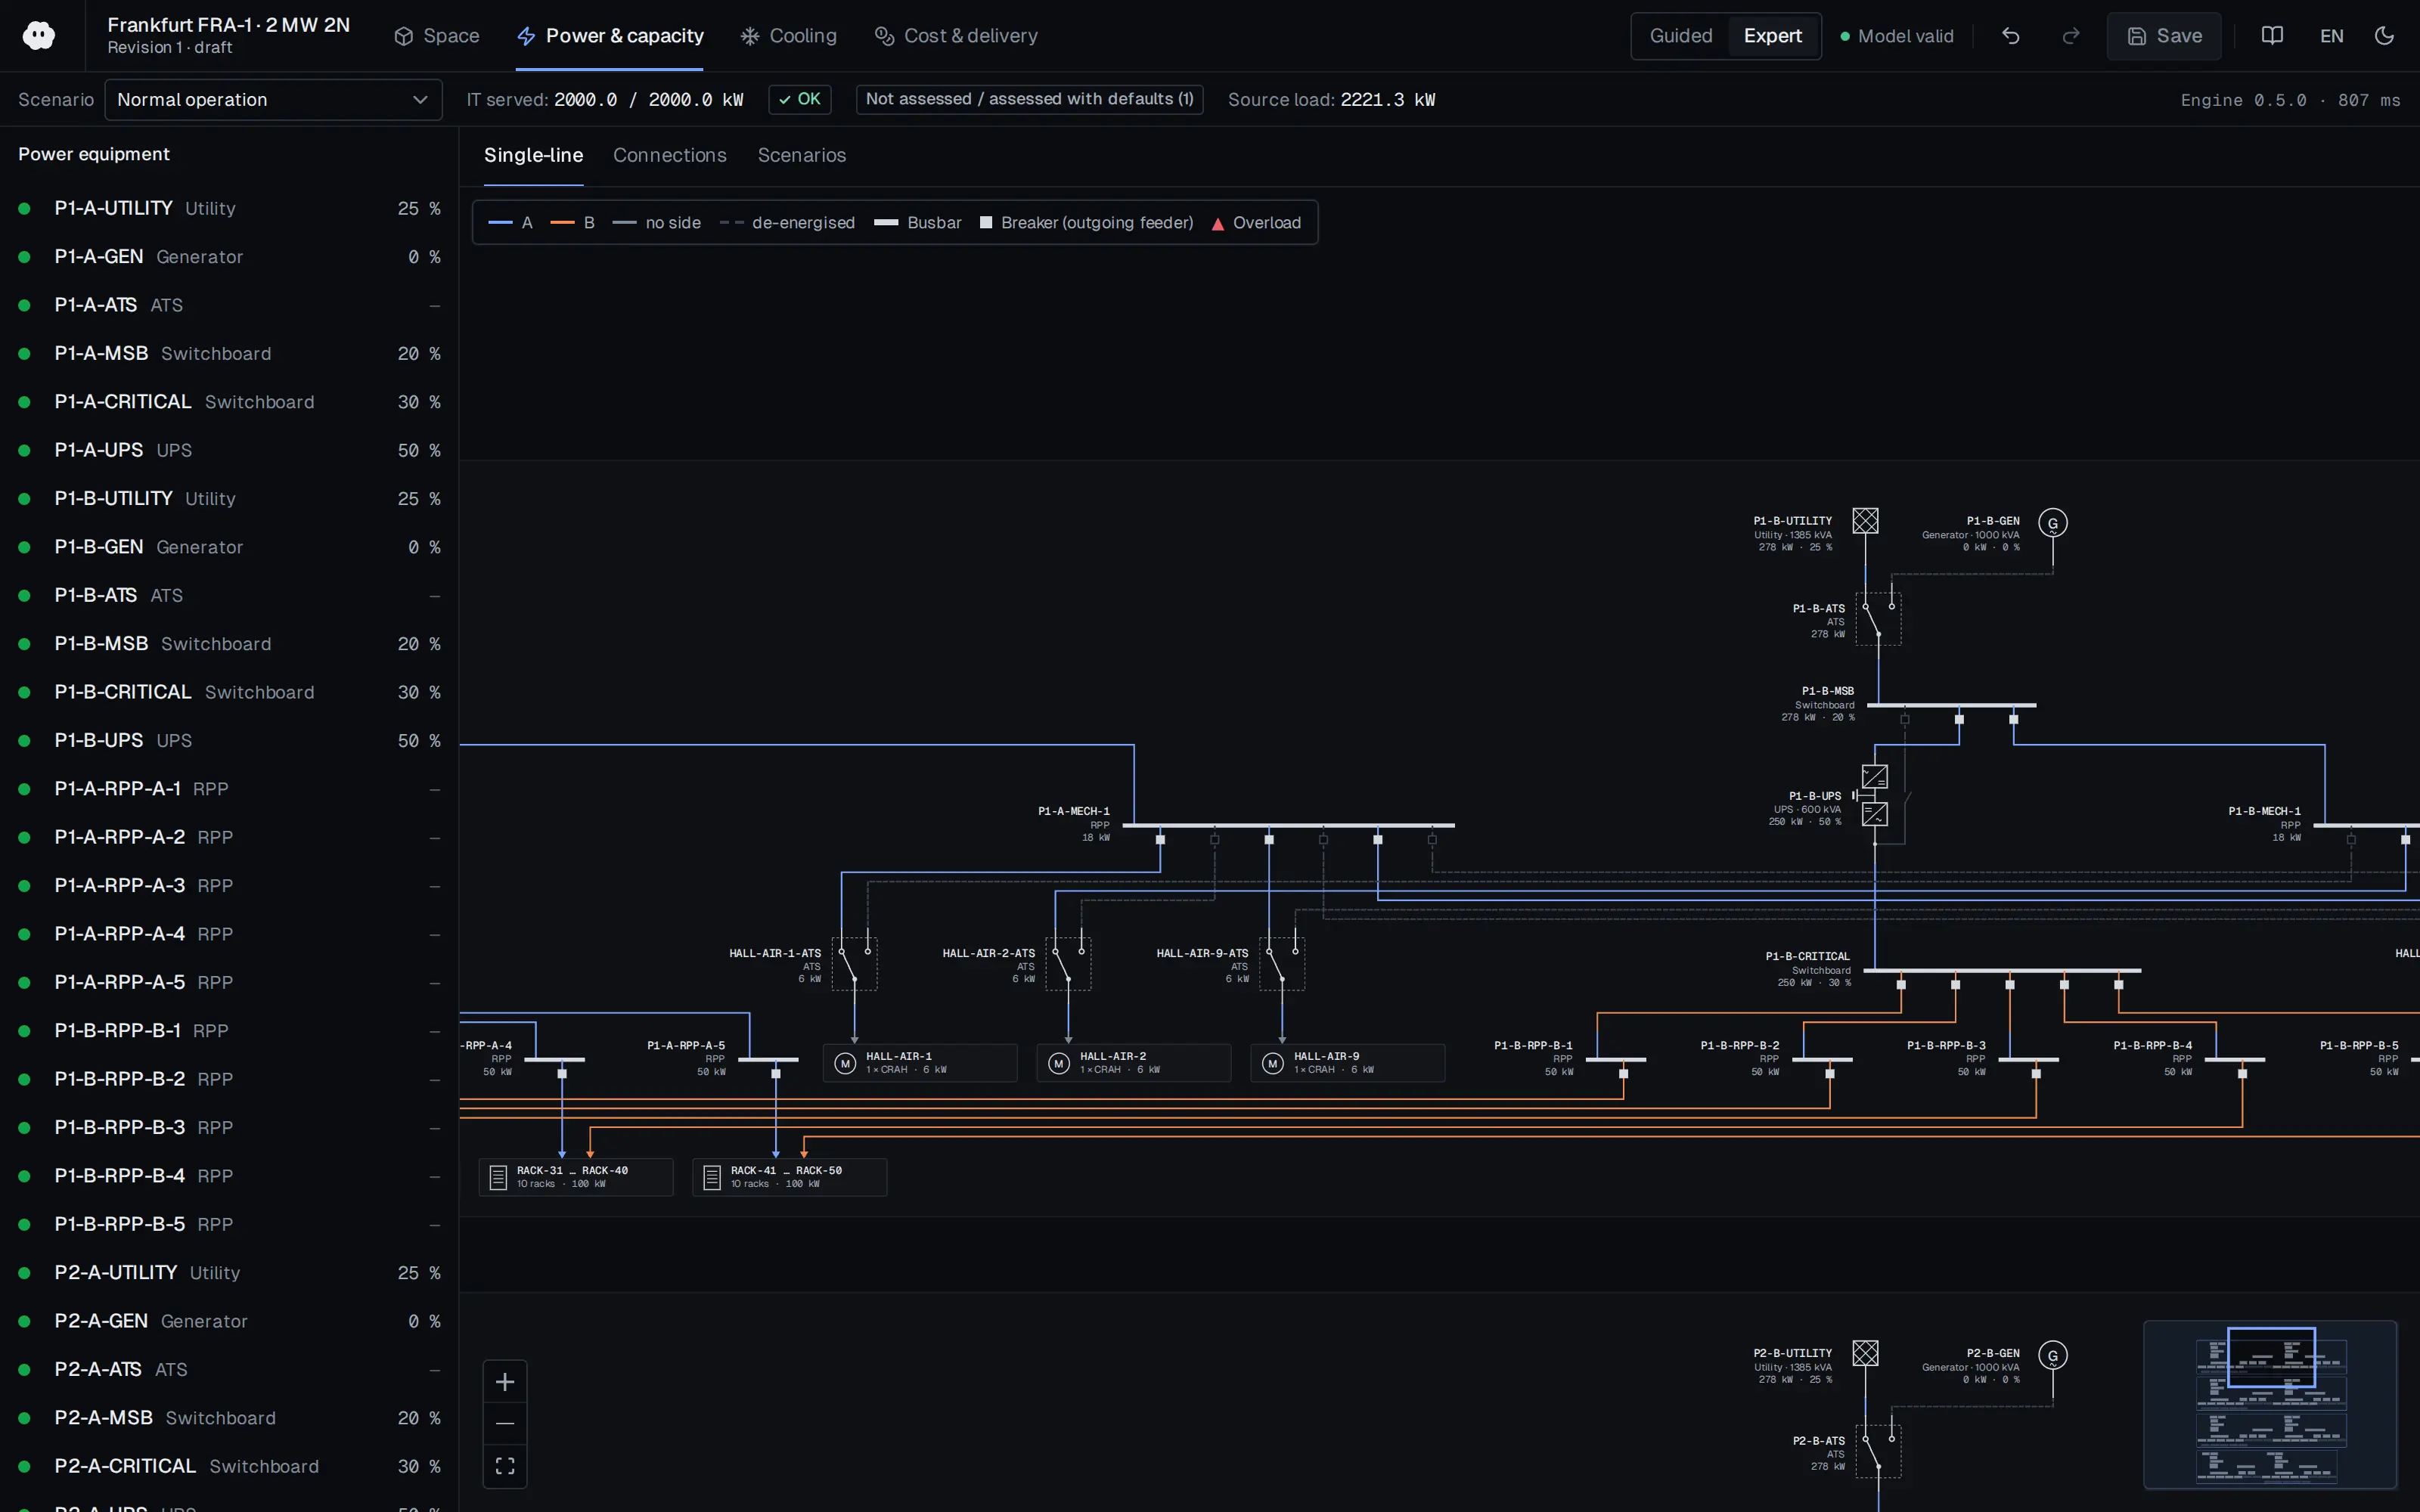
Who should read it
Power-system engineers and data-centre energy managers evaluating UPS and workload flexibility for grid frequency services.
Document contents
- 1. Introduction
- 2. Fast Frequency Response (2.1 Concept and Motivation, 2.2 Power System Frequency Dynamics, 2.3 Primary and Fast Frequency Response Control, 2.4 Integration of Data-Center-Based FFR, 2.5 Analytical Insights)
- 3. Data Centers (3.1 Power Composition and Load Characteristics, 3.2 IT Server Load Modulation, 3.3 UPS Energy Storage Coordination, 3.4 Coordinated Control Strategy, 3.5 Integration into System Model)
- 4. Case Study (4.1 Test System Description, 4.2 Simulation Scenarios, 4.3 Parameter Configuration, 4.4 Performance Metrics, 4.5 Implementation Notes)
- 5. Simulation Results and Discussion (5.1 Frequency Response Performance, 5.2 Data Center Power Dynamics, 5.3 UPS State-of-Charge Evolution, 5.4 Sensitivity to Control Parameters, 5.5 Quantitative Performance Comparison, 5.6 Discussion)
- 6. Conclusion and Future Work
Related standards
- IEC 62040-3
- IEEE 1547
Read the document
dc-fast-frequency-response-ups-coordination-2025.pdf
CC BY 4.0 — share with attribution
The document is provided unaltered because its licence permits redistribution.
Publication details
- Authors
- Xiaojie Tao; Rajit Gadh
- Publisher
- IEEE Access (Institute of Electrical and Electronics Engineers (IEEE))
- Year
- 2025
- Document number
- arXiv:2512.14128
- Volume
- 13
- Pages
- 214511-214519
- Document language
- English
- Source type
- Scientific
- Access
- Open licence — downloadable
- Licence
- CC BY 4.0 — share with attribution
- Licence evidence
- arxiv.org
Original licence note
The redistributed file is the arXiv version (arXiv:2512.14128v1), which arXiv's OAI-PMH record lists under http://creativecommons.org/licenses/by/4.0/; the IEEE Access version is also CC BY.
Citation
Xiaojie Tao; Rajit Gadh (2025). Fast Frequency Response Potential of Data Centers Through Workload Modulation and UPS Coordination. IEEE Access (Institute of Electrical and Electronics Engineers (IEEE)). arXiv:2512.14128. 13, 214511-214519. https://doi.org/10.1109/access.2025.3646120
Events on this subject
- Electricity Eurasia 2027
- ELECO 2026 Elektrik-Elektronik ve Biyomedikal Mühendisliği Konferansı
- The smarter E Europe (Intersolar Europe, ees Europe, Power2Drive, EM-Power)
All content and rights belong to the respective authors and publishers. SoSo CAD provides only the citation, its own summary and a link to the source, and is not responsible for the sources' content.
Related sources
All sources on this topic
IEEE Access (Institute of Electrical and Electronics Engineers (IEEE)) 2026
Review of the 800-VDC Power Delivery Architecture and Isolated 800-V to 48-V Converter Solutions for Future AI Data Centers
Define 800 VDC unipolar, ±400 VDC bipolar and 48/54 VDC busbar as separate voltage classes in the single-line diagram, each with its own conductor ampacity, breaker pole count and clearance (IEC 60664-1) checks.
- The OCP Open Rack V3 PSU specification targets above 97.5% peak efficiency and at least 96.5% across 30%-100% load.
arXiv preprint (University of Michigan) 2026
Grid Integration of AI Data Centers: A Critical Review of Energy Storage Solutions (arXiv preprint)
Layer storage by timescale (chip/server sub-ms to ms, rack ms to seconds, UPS and GiUPS sub-second to 10 s, BESS minutes to hours) and show each layer's duty in the coordination scheme.
- Rapid AI load variations often induce 5-10% voltage swings within milliseconds.
Advances in Applied Energy (Elsevier BV) 2026
Grid Integration of AI Data Centers: A Critical Review of Energy Storage Solutions
Layer storage by timescale: GPU/server supercapacitors for sub-second swings, rack BBUs for minutes, facility GiUPS and BESS for grid services and longer durations; show each layer's duty and coordination separately in the architecture.
- BESS cost fell from about $7,500/kWh in 1991 to $133/kWh in 2024, with about $80/kWh projected by 2030.
Electronics (MDPI AG) 2018
Design of an Highly Efficient AC-DC-AC Three-Phase Converter Using SiC for UPS Applications
When selecting double-conversion UPS, include the measured efficiency curve by load point and the annual energy cost of the loss difference (here about 1380 USD per year for 450 W) in total cost of ownership.
- The 450 W loss reduction is worth about 1380 USD per year of continuous operation at German electricity prices.
U.S. EPA / ENERGY STAR 2017
ENERGY STAR Program Requirements for Uninterruptible Power Supplies (UPSs) - Partner Commitments, Eligibility Criteria Version 2.0, and Test Method (Rev. Dec-2017)
Write the Version 2.0 thresholds into UPS procurement as a floor; for VFI units above 10,000 W compute the minimum from 0.0058 x ln(P) + 0.886 for the actual rating.
- Modular UPSs in the 1,500-10,000 W range receive an efficiency allowance (EMOD) of 0.004.
U.S. Environmental Protection Agency (ENERGY STAR) 2017
ENERGY STAR Program Requirements for Uninterruptible Power Supplies (UPSs): Test Method (Rev. Nov-2017), Version 2.0
Store efficiency at 25/50/75/100% load for each normal mode (double-conversion, eco/ESS) in UPS catalogue entries, measured to IEC 62040-3.
- The boundary between high-voltage and low-voltage dc output is 60 V.