
A Novel Reliability Index to Assess the Computational Resource Adequacy in Data Centers
IEEE Access (Institute of Electrical and Electronics Engineers (IEEE)) · Kazi Main Uddin Ahmed, Manuel Alvarez et al.
The loss of workload probability (LOWP) index, modelled on the power-system LOLP, combines rack PSU outage probability with the workload duration curve to quantify how many spare servers or PSUs a rack needs.
CC BY 4.0 — share with attribution
On this page
Overview
The paper addresses how to right-size rack-level computing resources for the workload and for the reliability level the investor wants. The LOWP index combines the binomial outage probability of rack PSUs with the rack's load-duration curve. PSU availability is derived from IEEE Gold Book industrial rectifier data (MTTF 1,960,032 h, MTTR 16 h): pa = 0.999991836934606, qu = 8.163 × 10^-6. Rack power is built from server utilisation traces in the public Google cluster data set plus fan and PSU models.
The example rack has 10 blade servers rated 800 W each (400 W idle) and 40 local fans. PSU outages are modelled as k-out-of-n with a binomial distribution; in a 10-PSU rack (0.8 kW each), three simultaneous PSU failures leave 5.6 kW and the authors conclude three spare PSUs/servers give acceptable risk. With a 5.4 kW base load and 5.6 kW demand present 60% of the time, the example rack's LOWP is 3.9162 × 10^-14 %.
Losses in the power conditioning chain are also modelled as functions of utilisation. At rack level, average loss is 5.8% of rack rated power for the PDU, 2.8% for the UPS and 0.65% for the rack's 10 PSUs. At aggregate level the IPSS (UPS, PDU, PSU) consumes more than 10% of rated IT load (10.07 MW), and PDUs lose more energy in total than UPSs.
Limits: cable losses and redundant UPS-PDU paths are neglected; results rest on one published workload data set and generic PSU failure data; the index should be read together with the investor's target reliability and is not validated against measurements from an operating facility. The modular approach is said to extend to cooling loads.
Key points
- PSU availability derived from IEEE Gold Book industrial rectifier data (MTTF 1,960,032 h, MTTR 16 h): pa = 0.999991836934606, qu = 8.1630653943 × 10^-6.
- Rack PSU outages are modelled as k-out-of-n with a binomial distribution; in a 10-PSU rack (0.8 kW each), three simultaneous failures leave 5.6 kW and three spare PSUs/servers give acceptable risk.
- With a 5.4 kW base load and 5.6 kW demand present 60% of the time, the example rack's LOWP is 3.9162 × 10^-14 %.
- Average power loss at rack level is 5.8% of rack rated power for a PDU, 2.8% for a UPS and 0.65% for the 10 PSUs of a rack.
- The IPSS (UPS, PDU, PSU) consumes more than 10% of rated IT load (10.07 MW) at aggregate level; the study neglects cable losses and redundant UPS-PDU paths.
- The rack model assumes 10 blade servers rated 800 W each (400 W idle) with 40 local fans.
Using it in design
- Set the number of spare PSUs/servers in a rack with a LOWP-style calculation from target service reliability and the load duration curve, avoiding unnecessary overprovisioning.
- Model PDU, UPS and PSU losses as functions of utilisation in the power-chain energy budget, bearing in mind that PDU loss can exceed UPS loss.
- Use LOWP to identify which rack groups should run at high adequacy for latency-sensitive workloads.
Monthly newsletter · free
Keep your reading list current
Once a month: new library sources, changes to Turkish regulations and upcoming data centre events.
SoSo CAD
Assess redundancy through scenarios
Compare normal operation and equipment failures in SoSo CAD, with supplied loads and capacity shortfalls in one view.
Request a demo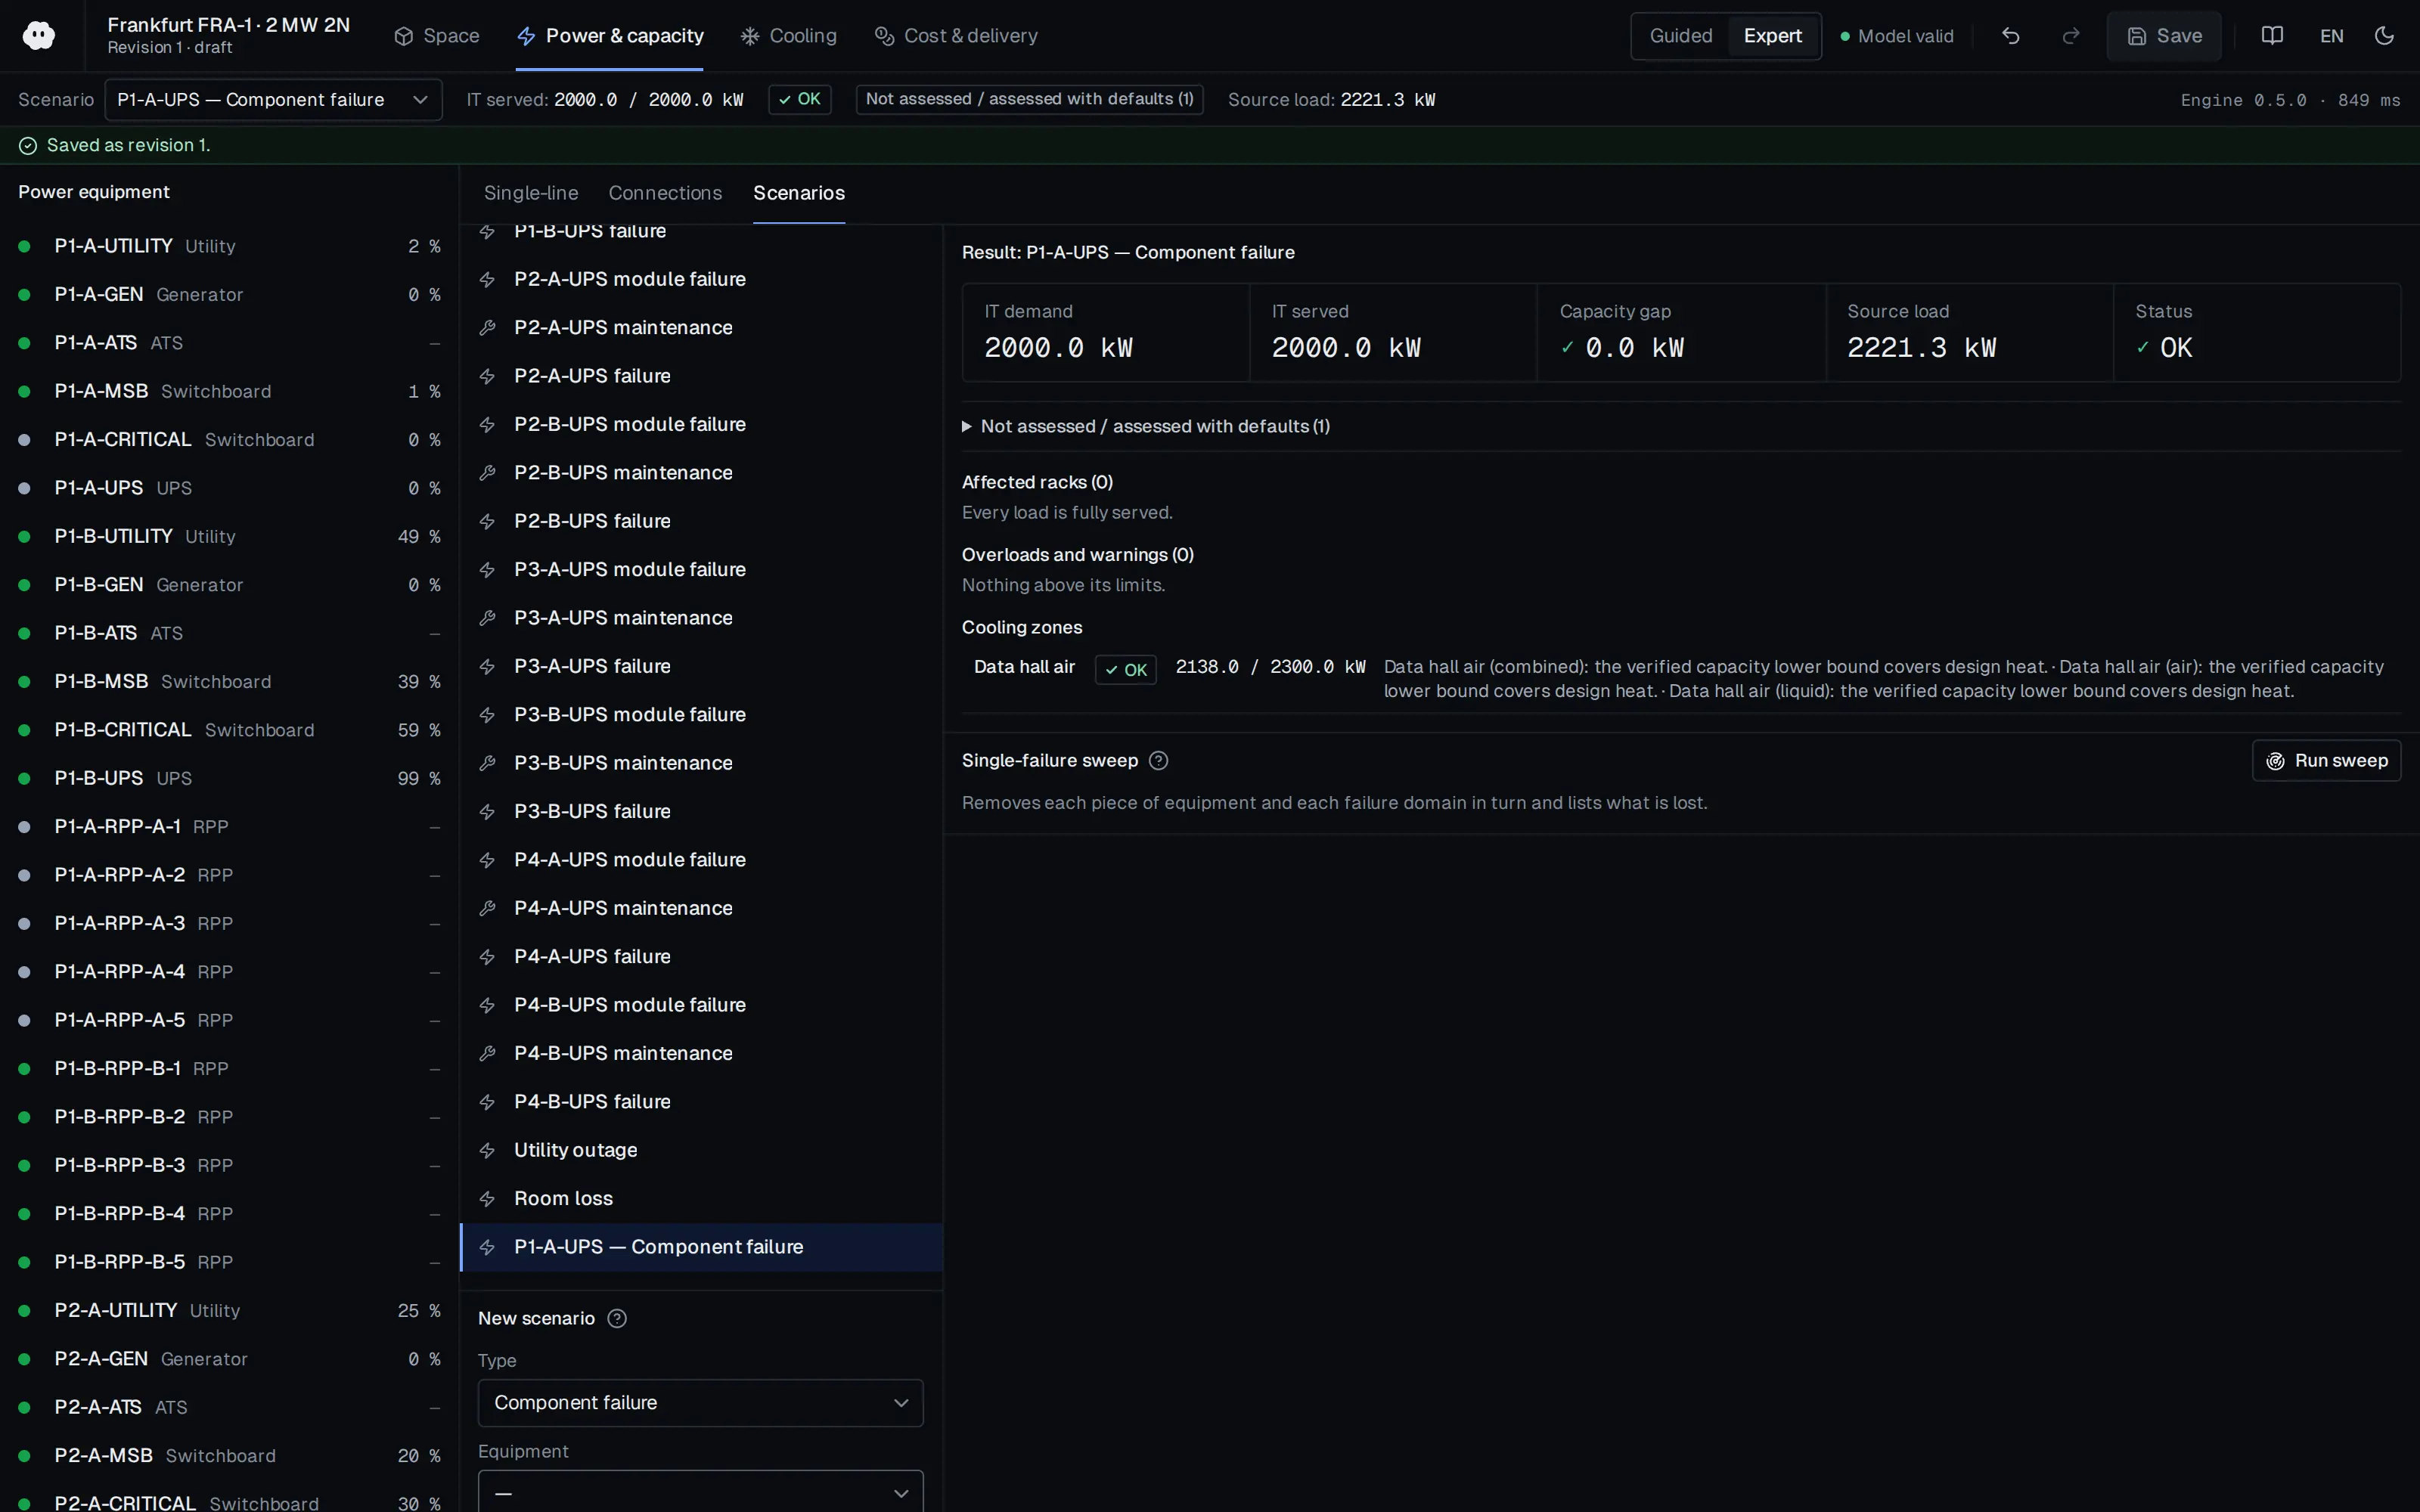
Who should read it
Designers and operations planners sizing rack-level capacity, redundancy and power-chain losses.
Document contents
- I. Introduction
- II. State of the Art (A. Reliability-based computation resource adequacy, B. Power consumption modeling of IT loads and power supply components, C. Application of real data set in power analysis)
- III. Methods and Procedures (A. Loss of workload probability (LOWP), B. Power consumption models of load sections, C. Google data set structure and processing)
- IV. Results and Analysis (A. Power consumption models, B. Rack level computational resource)
- V. Discussion and Contribution
- VI. Conclusion and Recommendations
Related standards
- IEEE 493-2007
Read the document
dc-computational-adequacy-reliability-index-2021.pdf
CC BY 4.0 — share with attribution
The document is provided unaltered because its licence permits redistribution.
Publication details
- Authors
- Kazi Main Uddin Ahmed; Manuel Alvarez; Math H. J. Bollen
- Publisher
- IEEE Access (Institute of Electrical and Electronics Engineers (IEEE))
- Year
- 2021
- Volume
- 9
- Pages
- 54530-54541
- Document language
- English
- Source type
- Scientific
- Access
- Open licence — downloadable
- Licence
- CC BY 4.0 — share with attribution
- Licence evidence
- ieeexplore.ieee.org
Original licence note
PDF footer on p.1 states 'This work is licensed under a Creative Commons Attribution 4.0 License'.
Citation
Kazi Main Uddin Ahmed; Manuel Alvarez; Math H. J. Bollen (2021). A Novel Reliability Index to Assess the Computational Resource Adequacy in Data Centers. IEEE Access (Institute of Electrical and Electronics Engineers (IEEE)). 9, 54530-54541. https://doi.org/10.1109/ACCESS.2021.3070915
Events on this subject
- Electricity Eurasia 2027
- ELECO 2026 Elektrik-Elektronik ve Biyomedikal Mühendisliği Konferansı
- 7x24 Exchange Spring Conference
All content and rights belong to the respective authors and publishers. SoSo CAD provides only the citation, its own summary and a link to the source, and is not responsible for the sources' content.
Related sources
All sources on this topicarXiv preprint (Microsoft / OpenAI / NVIDIA) 2025
Power Stabilization for AI Training Datacenters
For AI-training halls, carry a 'synchronous load' flag and capture utility time-domain (MW/s ramp up/down, dynamic range) and frequency-domain (critical band, spectral cap) limits as interconnection inputs.
- GPU power smoothing with the floor at 90% of TDP gave a total energy overhead of 10.5% in simulation.
IEEE Access (Institute of Electrical and Electronics Engineers (IEEE)) 2026
Review of the 800-VDC Power Delivery Architecture and Isolated 800-V to 48-V Converter Solutions for Future AI Data Centers
Define 800 VDC unipolar, ±400 VDC bipolar and 48/54 VDC busbar as separate voltage classes in the single-line diagram, each with its own conductor ampacity, breaker pole count and clearance (IEC 60664-1) checks.
- The OCP Open Rack V3 PSU specification targets above 97.5% peak efficiency and at least 96.5% across 30%-100% load.
IEEE Open Journal of Power Electronics (Institute of Electrical and Electronics Engineers (IEEE)) 2026
State-of-the-Art Power Electronics in AI Data Centers
In rack power templates, model PSU count per shelf and the 33 kW shelf limit for AC distribution, and check busbar, PDU and cooling impact together for racks that exceed 100 kW with several shelves.
- AI rack density is 30-100+ kW against 7-10 kW for traditional racks; an 8-GPU DGX H100 draws around 10,200 W.
IEEE Access (Institute of Electrical and Electronics Engineers (IEEE)) 2021
A Review of Data Centers Energy Consumption and Reliability Modeling
Define the failure state (loss of PDU power, loss of a rack, loss of service) explicitly before starting a reliability study and state it in the report.
- Cooling-system operational availability is AO = 1/(λsys/µsys + 1) and functional availability is Af = AO(1 − pus) + (1 − AO)·pt.
arXiv preprint (University of Michigan) 2026
Grid Integration of AI Data Centers: A Critical Review of Energy Storage Solutions (arXiv preprint)
Layer storage by timescale (chip/server sub-ms to ms, rack ms to seconds, UPS and GiUPS sub-second to 10 s, BESS minutes to hours) and show each layer's duty in the coordination scheme.
- Rapid AI load variations often induce 5-10% voltage swings within milliseconds.
WSEAS TRANSACTIONS ON POWER SYSTEMS (World Scientific and Engineering Academy and Society (WSEAS)) 2026
Design and Prototype of a Microgrid for Enhancing Reliability of Power Supply for Artificial Intelligence Data Centers
Follow the energy-balance chain in a PV/BESS sizing helper (daily load split, conversion losses, usable depth of discharge, power rating against night peak); report usable-energy duration rather than nameplate duration and make DoD an explicit input.
- Covering 60% of demand needs 81,857 kWh/day from PV after 5% DC-AC and 10% battery losses.