
United States Data Center Energy Usage Report (LBNL-1005775, June 2016)
Lawrence Berkeley National Laboratory · Arman Shehabi, Sarah Smith et al.
The LBNL report estimating U.S. data center electricity use from 2000 to 2014 and projecting it to 2020, with efficiency scenarios and PUE by facility type. It was superseded by LBNL's 2024 report.
On this page
Overview
The report rebuilds historical data center electricity use back to 2000 from earlier studies and shipment data, then forecasts to 2020. U.S. data centers used an estimated 70 billion kWh in 2014, about 1.8% of national consumption. Growth was nearly 90% over 2000-2005, about 24% over 2005-2010 and about 4% over 2010-2014, and the report projects another 4% by 2020, to about 73 billion kWh. Earlier reference points are 61 billion kWh in 2006 (1.5%) and 69 billion kWh for 2008 (1.8%). Its method models servers, storage, network equipment and infrastructure by data center space type, using IDC shipment trackers and SPEC and SERT benchmark databases.
The slowdown is explained by supply-side trends. Server shipments grew 15% a year over 2000-2005, 5% over 2005-2010 and 3% after 2010, with nearly all post-2010 growth going to hyperscale data centers that run at high utilization and need fewer servers for the same service. Server power demand rose until 2005 and has been roughly constant since, while power scaling at low utilization improved. Storage drives became more efficient per drive and network port power estimates fell. A counterfactual that freezes utilization, power scaling, disk and port power and PUE at 2010 levels shows more than 600 billion kWh would have been needed across the decade.
Efficiency scenarios for 2020 are defined as improved management, best practices and hyperscale shift, plus two combinations. Relative to current trends they cut server energy by 4%, 18% and 28% respectively, and infrastructure energy by 22%, 64% and 46%. Storage energy is lower by 25% and network energy by 38% only in the best-practices case. Together the scenarios save up to 33 billion kWh a year in 2020, about 45% below current trends. Infrastructure energy is PUE multiplied by IT energy, so IT reductions and PUE gains compound. The assumed 2014 PUE values run from 2.5 for server rooms down to 1.2 for hyperscale.
Further chapters cover federal government servers under the Federal Data Center Consolidation Initiative, indirect energy impacts of ICT, and water: electricity generation consumes on average about 7.6 L (2.0 gal) of water per kWh delivered, counted as indirect footprint. The future-work chapter says the data are limited and that PUE reflects only building infrastructure, not IT efficiency, naming alternatives such as DCeP and CADE. It warns that PUE gains, utilization and power proportionality have limits, so the plateau may not last. The study is dated and its projections end at 2020.
Key points
- U.S. data centers used an estimated 70 billion kWh in 2014, about 1.8% of national electricity use, with about 73 billion kWh projected for 2020.
- Electricity use grew about 4% over 2010-2014, versus about 24% over 2005-2010 and nearly 90% over 2000-2005.
- Server shipment growth fell from 15% a year (2000-2005) to 5% (2005-2010) and 3% after 2010, nearly all of it into hyperscale facilities.
- Assumed 2014 PUE by space type: 2.0 closets, 2.5 server rooms, 2.0 localized, 1.9 mid-tier, 1.7 high-end, 1.2 hyperscale.
- In the 2014 hyperscale PUE breakdown, cooling adds 0.16, transformers 0.02 and lighting 0.02 per unit of IT energy; for server rooms cooling alone adds 1.23.
- Combined efficiency scenarios could cut 2020 electricity use by up to 33 billion kWh a year, about 45% below current trends.
- Efficiency improvements since 2010 are estimated to save 620 billion kWh over 2010-2020 compared with 2010 efficiency levels.
- Best practices cut infrastructure energy by 64% and, with hyperscale shift, by 75%, relative to current trends.
- Electricity generation consumes on average about 7.6 L (2.0 gal) of water per kWh delivered in the U.S., counted in the indirect water footprint.
- PUE measures only the building infrastructure, so the report points to productivity metrics such as DCeP and CADE.
Using it in design
- Use the space-type PUE table as a sanity check on early-stage PUE assumptions, remembering these are 2014 national averages, not design targets.
- Break PUE into cooling, power distribution and lighting contributions the way the report does when comparing design options.
- Compare a planned facility's PUE against the hyperscale 1.2 and server room 2.5 values to show the efficiency gap when justifying consolidation or an efficient design.
- Include indirect water of grid electricity (about 7.6 L/kWh average) alongside on-site water when comparing cooling approaches.
- Prefer the 2024 LBNL report for current planning and use this one for historical trend context.
Monthly newsletter · free
Keep your reading list current
Once a month: new library sources, changes to Turkish regulations and upcoming data centre events.
SoSo CAD
Compare the cost of design decisions
Evaluate equipment costs, energy expenses and total cost of ownership (TCO) using your inputs and assumptions in SoSo CAD.
Request a demo
Who should read it
Planners, policy analysts and design engineers who need historical U.S. data center energy trends and benchmark PUE by facility type.
Document contents
- Executive Summary
- 1 Introduction
- 1.1 Report Scope
- 1.2 Report Organization
- 2 Estimates of U.S. Server and Data Center Energy Use
- 2.1 Methodology Overview
- 2.2 Data
- 2.3 IT and Infrastructure Equipment Estimates
- 3 Energy Use Associated with Federal Government Servers and Data Centers
- 4 Expected Energy Savings Opportunities
- 4.2 Improved Management scenario
- 4.3 Best practices scenario
- 4.4 Hyperscale Shift scenario
- 5 Indirect energy impacts
- 6 Future Work
Publication details
- Authors
- Arman Shehabi; Sarah Smith; Dale Sartor; Richard Brown; Magnus Herrlin; Jonathan Koomey; Eric Masanet; Nathaniel Horner; Inês Azevedo; William Lintner
- Publisher
- Lawrence Berkeley National Laboratory
- Year
- 2016
- Document language
- English
- Source type
- Government / public
- Access
- Citation only
- Licence
- Licence conditions not established — confirm the conditions with the publisher
- Licence evidence
- datacenters.lbl.gov
Original licence note
LBNL contractor report; no explicit public-domain or open license statement. Treat as copyrighted by the lab operator (UC) pending confirmation.
Citation
Arman Shehabi; Sarah Smith; Dale Sartor; Richard Brown; Magnus Herrlin; Jonathan Koomey; Eric Masanet; Nathaniel Horner; Inês Azevedo; William Lintner (2016). United States Data Center Energy Usage Report (LBNL-1005775, June 2016). Lawrence Berkeley National Laboratory. https://eta-publications.lbl.gov/sites/default/files/lbnl-1005775_v2.pdf
Events on this subject
Browse the events calendarAll content and rights belong to the respective authors and publishers. SoSo CAD provides only the citation, its own summary and a link to the source, and is not responsible for the sources' content.
Related sources
All sources on this topicLawrence Berkeley National Laboratory 2024
2024 United States Data Center Energy Usage Report (LBNL-2001637, December 2024)
Take AI rack and node power assumptions (3.4 to 12.2 kW per 8-GPU server, 20% idle) as a cross-check on IT load models, not as a substitute for vendor data.
- U.S. data centers used about 76 TWh (1.9% of U.S. electricity) in 2018 and 176 TWh (4.4%) in 2023.
European Commission, DG Energy 2025
Assessment of the energy performance and sustainability of data centres in EU - First technical report (July 2025)
Compare your design PUE target with the real EU spread: 1.21 on average above 10 MW, 1.55 at 1-2 MW; set a realistic bound for your facility size.
- Rule of thumb cited: PUE below 1.2 excellent, 1.2-1.5 good, above 1.5 room for improvement.
European Commission (Official Journal of the European Union) 2024
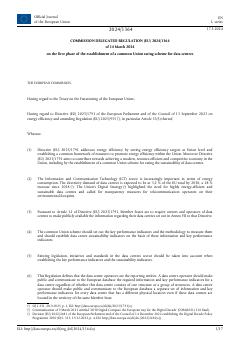
Commission Delegated Regulation (EU) 2024/1364 of 14 March 2024 on the first phase of the establishment of a common Union rating scheme for data centres
Build the metering architecture to the regulation: meters on every supply input for total energy (grid and back-up generator separately) and at every UPS output for IT energy, with a system that retains measurement point and device records for at least 10 years.
- Data centre electricity demand is projected to reach 3.2% of total EU demand by 2030, a 28% increase over 2018.
Open Compute Project Foundation 2024
Data Center Facility Sustainability Metrics (OCP Data Center Facility white paper, October 2, 2024)
Build the metering plan so that PUE can be reported at the highest category possible, with IT load measured at PDU or equipment input rather than the UPS output where feasible.
- External reporting is annual (required) and quarterly on a trailing 12 months (recommended); internal tracking should be continuous or monthly.
arXiv preprint 2026
The fallacy of sustainable Generative AI: limitations in EU environmental regulation of data centres and paths forward
For EU projects, add an EED compliance module that flags facilities of 500 kW and above as reportable.
- The second EU technical report suggests targets of PUE 1.3 for new data centres and WUE below 0.4 m3/MWh.
Digital Realty 2025
Digital Realty: Sustainability (portfolio PUE and renewable coverage)
Use portfolio PUE of about 1.38-1.4 as the benchmark for multi-tenant colocation (against hyperscale about 1.1 and industry about 1.54).
- Portfolio PUE 1.38.