
TM 5-698-5 Survey of Reliability and Availability Information for Power Distribution, Power Generation, and Heating, Ventilating and Air Conditioning (HVAC) Components for Commercial, Industrial, and Utility Installations (22 July 2006)
Headquarters, Department of the Army (U.S. Army Corps of Engineers PREP) · Headquarters, Department of the Army
Describes how the U.S. Army Corps of Engineers Power Reliability Enhancement Program (PREP) collected field reliability data for more than 200 power and HVAC components. The database in Appendix B is a widely cited source of failure rates for data centre power and cooling models.
U.S. public domain — U.S. Government work; free to reuse
On this page
Overview
TM 5-698-5 explains how the reliability data in Appendix B was developed and what types of facilities supplied it, so that a facility engineer can understand the foundation of the metrics and apply them with more knowledge. The data is the product of the U.S. Army Corps of Engineers Power Reliability Enhancement Program (PREP) effort to establish reliability, availability and maintainability characteristics of over 200 components related to C4ISR facilities. Collection began in October 1991 and the final report was delivered in early 1994. The effort totalled about 24,000 man-hours.
The program's rationale was to measure the effect of 'new technology' on equipment installed after 1971. The earlier study, published in the early 1970s in the IEEE Gold Book, used data from the 1950s and 1960s; PREP judged that data both outdated and weak on maintenance. The database required at least 40 like components per class (no more than 10 from a single site), at least five years of operating data per site and at least 3.5 million calendar hours per component. Facility types included communication centres, office, educational and hospital complexes, manufacturing, electric generating plants, municipal buildings and petroleum processing.
During collection over 4,000 facilities were identified, 1,593 were called and, at roughly a 10 percent success rate, 162 sites were visited; electric generating plants and hospitals made up 58 percent of contributors. Data from 28 of the 162 visited facilities was rejected for deficiencies. Data was graded in four quality levels: perfect (20 percent), not perfect (40 percent), verbal/inspection (25 percent) and soft data (15 percent). Facilities were coded in three maintenance-policy levels, and results are presented at the average maintenance level across all sources because maintenance quality proved a major predictor of availability.
The limits are well defined: data was collected in 1991-1994 on equipment installed after 1971, so values for modern UPS, generators and chillers are dated and some classes have few failures behind them. The text presents values as a comparison baseline, not as a prediction for a specific facility. For modelling method see TM 5-698-1 and TM 5-698-3. Appendix B gives, for each component class, inherent reliability, inherent and operational availability, unit-years, failure rate, MTBF, MTTR, MDT and MTBM.
Key points
- PREP collected RAM data on more than 200 C4ISR-related components from October 1991, with the final report delivered in early 1994.
- Batteries: 10,543.8 unit-years, 74 failures, 0.00702 failures/yr, MTBF about 1,248,161 h, MTTR 12.11 h, inherent availability 0.99999.
- Chillers: 239 failures over 2,021.9 unit-years (0.1182 failures/yr), MTBF about 74,110 h, MTTR 12.62 h, operational availability 0.99762.
- Diesel engine generators overall: 0.528 failures/yr, MTBF about 16,590 h, MTTR 24.22 h, operational availability 0.99399.
- Packaged standby diesel generators (250 kW-1.5 MW): 0.1235 failures/yr, MTBF about 70,932 h, MTTR 18.28 h; continuous-duty units fail about 0.583 times/yr.
- Switchgear (E36): 0.00812 failures/yr, MTBF about 1,079,291 h, MTTR 27.56 h, inherent availability 0.99997. Dry-type transformers: 0.00005 failures/yr over 11,025 unit-years; liquid-filled transformers: 0.00522 failures/yr, MTTR 82.74 h.
- UPS: 4 failures over 553.1 unit-years (0.00092 failures/yr), MTBF about 9,499,764 h, inherent availability 0.9999983; small computer-room floor UPS (E39-200): only 4 failures in 426.4 unit-years, MTTR 2.0 h; the UPS category roll-up reports no MTTR.
- Class E34-110 (automatic transfer switches above 600 A at 600 V or less): 22 failures in 690.3 unit-years, MTBF about 274,854 h and MTTR 1.64 h.
- PREP MTBF is the collection period divided by failures and MTTR is corrective repair downtime divided by failures, excluding logistics delay; zero-failure items use a 60% one-sided chi-squared time-truncated bound.
- Data quality split: 20 percent perfect, 40 percent not perfect, 25 percent verbal/inspection and 15 percent soft data; 28 of 162 visited facilities had data rejected.
Using it in design
- When modelling the power and cooling chain use these values as starting failure rates and MTBF/MTTR inputs and convert them into availability with the method of TM 5-698-1.
- For modern equipment check the deviation against manufacturer data and field experience; the data rests on 1991-1994 and on equipment installed after 1971, so UPS, generator and chiller values are dated.
- For classes with few failures (UPS 4 failures, small UPS 4 failures) test the statistical uncertainty with a sensitivity analysis, and note the 60 percent bound used for zero-failure items.
- Knowing that maintenance quality is the main predictor of availability, ask whether the average-maintenance assumption behind the tables matches your operating model.
- Read MTTR values without logistics delay (add spare-part and shift delays separately); long repair times such as 82.74 h for liquid-filled transformers affect spares planning.
- Document the data source (PREP, 1994) and class code (for example E36-110) for every model input.
Monthly newsletter · free
Keep your reading list current
Once a month: new library sources, changes to Turkish regulations and upcoming data centre events.
SoSo CAD
Assess redundancy through scenarios
Compare normal operation and equipment failures in SoSo CAD, with supplied loads and capacity shortfalls in one view.
Request a demo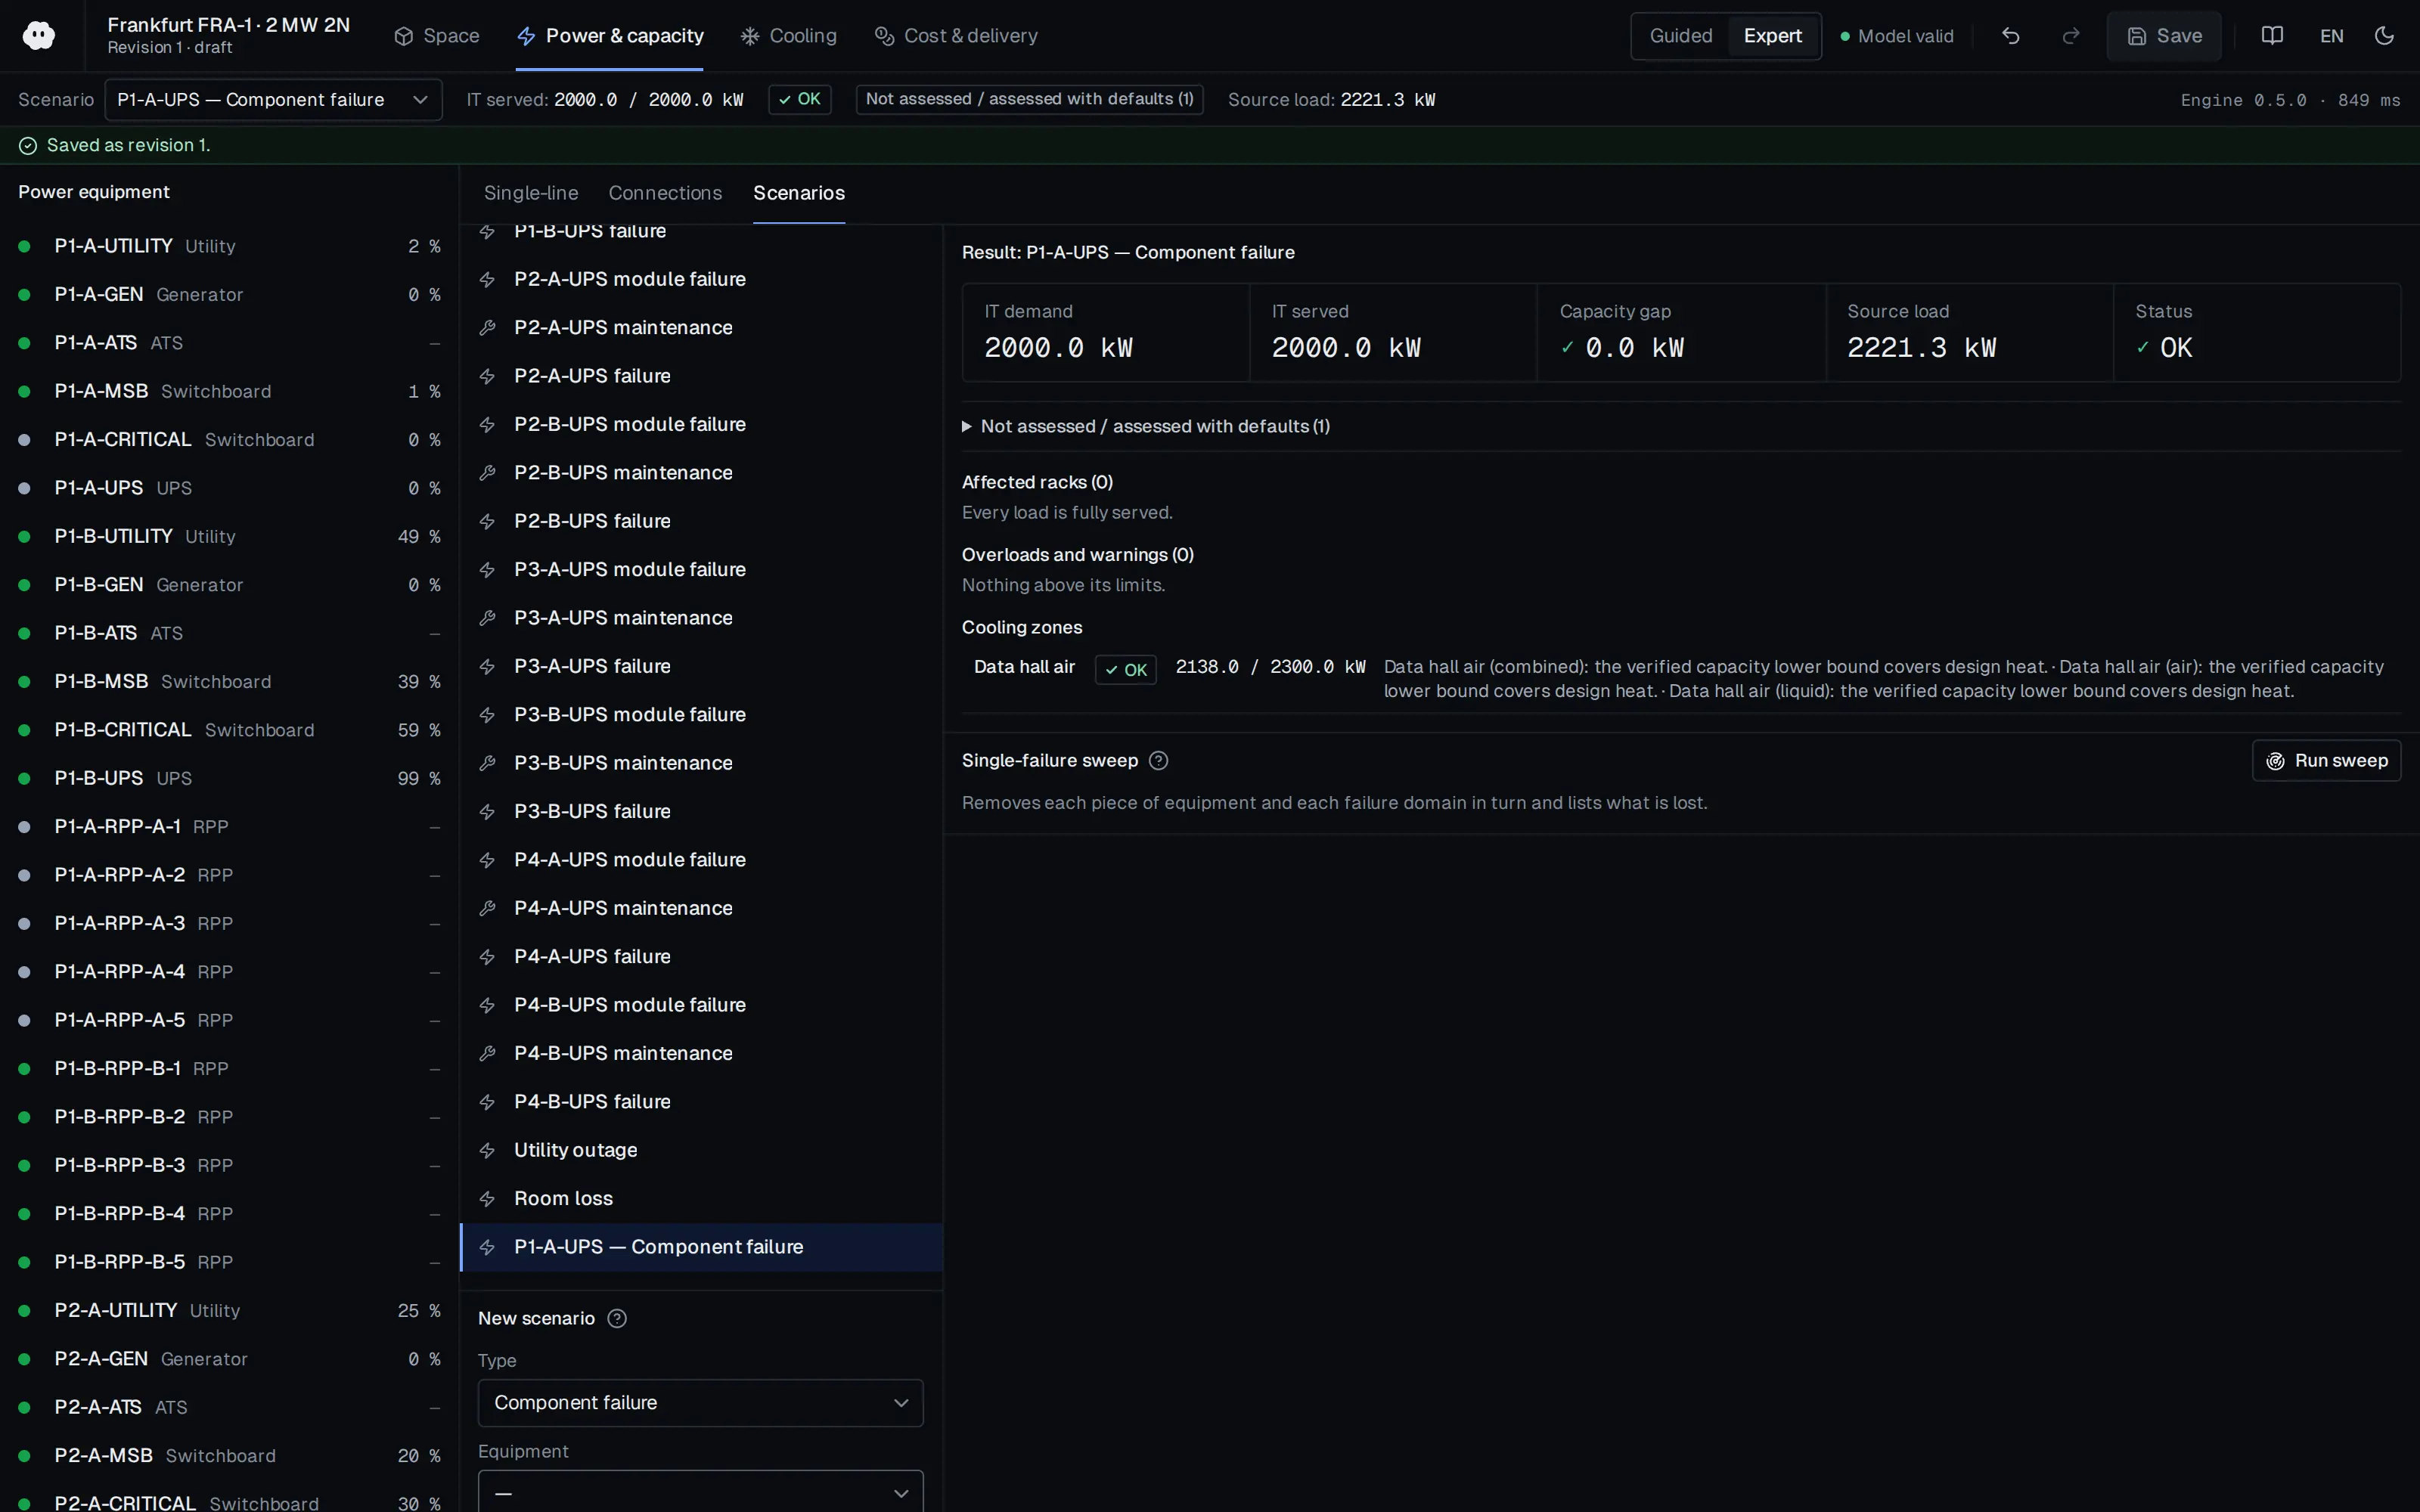
Who should read it
Reliability and electrical engineers performing availability modelling of power and cooling topologies.
Document contents
- Chapter 1 Introduction and Background: purpose, scope, background
- Chapter 2 Database Development: database conception, database update
- Chapter 3 Data Collection: overview, identifying contacts, data contributors
- Chapter 4 Data Summarization and Classification: data transformation, data issues, maintenance policies and classifications
- Chapter 5 Conclusions: results, benefits
- Appendix A References
- Appendix B Power Reliability Enhancement Program (PREP) Database
- Glossary
Read the document
usace-tm-5-698-5-reliability-data.pdf
U.S. public domain — U.S. Government work; free to reuse
The document is provided unaltered because its licence permits redistribution.
Publication details
- Authors
- Headquarters, Department of the Army
- Publisher
- Headquarters, Department of the Army (U.S. Army Corps of Engineers PREP)
- Year
- 2006
- Document language
- English
- Source type
- Government / public
- Access
- Open licence — downloadable
- Licence
- U.S. public domain — U.S. Government work; free to reuse
- Licence evidence
- www.copyright.gov
Original licence note
DoD/USACE criteria marked "Approved for public release; distribution unlimited"; work of the U.S. Government (17 U.S.C. 105).
Citation
Headquarters, Department of the Army (2006). TM 5-698-5 Survey of Reliability and Availability Information for Power Distribution, Power Generation, and Heating, Ventilating and Air Conditioning (HVAC) Components for Commercial, Industrial, and Utility Installations (22 July 2006). Headquarters, Department of the Army (U.S. Army Corps of Engineers PREP). https://www.wbdg.org/FFC/ARMYCOE/COETM/tm_5_698_5.pdf
Events on this subject
Browse the events calendarAll content and rights belong to the respective authors and publishers. SoSo CAD provides only the citation, its own summary and a link to the source, and is not responsible for the sources' content.
Related sources
All sources on this topic
Energies (MDPI AG) 2023
Reliability Assessment of the Configuration of Dynamic Uninterruptible Power Sources: A Case of Data Centers
When choosing among DRUPS or UPS configurations, first screen with the graph-based method to identify the best candidates, then do the detailed RBD calculation for that candidate only.
- Single system: λ = 3.10 × 10^-6 1/h, A = 0.999949, MTBF 306,600 h (35 years).
U.S. DoD (UFC) 2023
UFC 3-540-01 Engine-Driven Generator Systems for Prime and Standby Power Applications (1 August 2014, Change 3, 26 January 2023)
Include transient and steady-state loads, transformer inrush, motor starting and UPS load in the generator sizing study, and calculate UPS charging load using the minimum charging current allowed while on generator.
- Harmonic analysis is required when switching power supplies make up 25% or more of the system load.
FEMA 2014
FEMA P-1019, Emergency Power Systems for Critical Facilities: A Best Practices Approach to Improving Reliability (September 2014)
At critical-facility data centers, place generators, ATS, fuel tanks and pumps above the greatest of BFE + 3 ft, DFE + 1 ft and 500-year elevation + 1 ft, and prefer elevation to dry floodproofing.
- Generators over 300 kW are almost exclusively diesel-fueled.
Consulting-Specifying Engineer 2026
Know the electrical, power components in a data center
Seed facility-type templates with default UPS/generator redundancy and fuel autonomy from Table 1.
- Generators should be loaded to at least 30% to avoid wet stacking.
Uptime Institute 2026
Uptime Institute Annual Outage Analysis 2026 (8th annual) — press release (with 2025 findings)
Weight UPS, ATS/STS and generator failure modes highest in the reliability model
- About 1 in 10 outages has serious or severe impact
arXiv preprint (University College Dublin) 2025
Data Center Model for Transient Stability Analysis of Power Systems
Expose UPS transfer thresholds (voltage %, frequency Hz), return-to-mains delay and staggering across UPS modules as design parameters, and warn when all modules share identical thresholds and delays, since synchronised reconnection can re-trip the grid.
- Cooling accounts for about 30% of total power of standalone data centers and is modelled as an induction motor.