
Reliability Assessment of the Configuration of Dynamic Uninterruptible Power Sources: A Case of Data Centers
Energies (MDPI AG) · Kirill Varnavskiy, Fedor Nepsha et al.
A study that compares six diesel rotary UPS (DRUPS) configurations for a data centre using classical reliability block diagrams and an information-resource graph method that needs only the network structure, and proposes the second for fast early-stage screening.
CC BY 4.0 — share with attribution
On this page
Overview
The study asks how data-centre power supply configurations can be ranked quickly for reliability at early design stage, when equipment data is incomplete. Six DRUPS configurations are compared: single, parallel (2/3), cross link (3/4), isolated parallel, isolated redundant and distributed redundant. Classical indicators are computed with reliability block diagrams per IEC 61078:2016 using published component data.
The second method is an information-resource analysis that rests only on network structure (an oriented graph and adjacency matrix) and does not need uptime data for each UPS element. The authors find the rankings of the two methods broadly correlated: the correlation coefficient between MTBF and the informational indicator R is 0.793 (0.829), and both methods identify the single system and distributed redundant configurations as the extremes.
Block-diagram results: single system λ = 3.10 × 10^-6 1/h, A = 0.999949, MTBF 306,600 h (35 years); parallel (2/3) λ = 2.59 × 10^-7 1/h, A = 0.999997, MTBF 3,810,600 h (435 years); cross link (3/4) 3,793,080 h (433 years); isolated parallel (2/3) 3,898,200 h (445 years). Isolated redundant (2/3) has λ = 2.25 × 10^-6 1/h, A = 0.999949 and MTBF 420,480 h (48 years), barely better than a single system; distributed redundant (2/3) reaches λ = 4.09 × 10^-9 1/h and MTBF 243,659,400 h (27,815 years).
Limits: the method does not yet include the human factor, recovery time of the power supply or cost indicators, which are listed as future work. Very large MTBF values (hundreds of years) should be read as relative rankings for design comparison, not as real expected lifetimes. The graph method is proposed as a first screening step to find the best configuration, not as a replacement for detailed reliability study.
Key points
- Single system: λ = 3.10 × 10^-6 1/h, A = 0.999949, MTBF 306,600 h (35 years).
- Parallel (2/3): λ = 2.59 × 10^-7 1/h, A = 0.999997, MTBF 3,810,600 h (435 years); cross link (3/4) 3,793,080 h (433 years); isolated parallel (2/3) 3,898,200 h (445 years).
- Isolated redundant (2/3): λ = 2.25 × 10^-6 1/h, A = 0.999949, MTBF 420,480 h (48 years), barely better than a single system.
- Distributed redundant (2/3): λ = 4.09 × 10^-9 1/h, A = 1.000000 (to six decimals), MTBF 243,659,400 h (27,815 years).
- MTBF and informational indicator R correlate at 0.793 (0.829), and both identify the single system and distributed redundant configurations as the extremes.
- MTBF calculations used reliability block diagrams per IEC 61078:2016; the graph method needs only the network structure.
Using it in design
- When choosing among DRUPS or UPS configurations, first screen with the graph-based method to identify the best candidates, then do the detailed RBD calculation for that candidate only.
- Compare configurations by structure to avoid arrangements that look redundant but give near-single-system reliability, such as isolated redundant; mark common failure points explicitly.
- Present MTBF values in the reliability report as relative rankings, and state the source of component data and that the human factor and repair time are not included.
Monthly newsletter · free
Keep your reading list current
Once a month: new library sources, changes to Turkish regulations and upcoming data centre events.
SoSo CAD
Review your power design in SoSo CAD
Inspect supply paths, equipment loads and UPS failure scenarios in one model.
Request a demo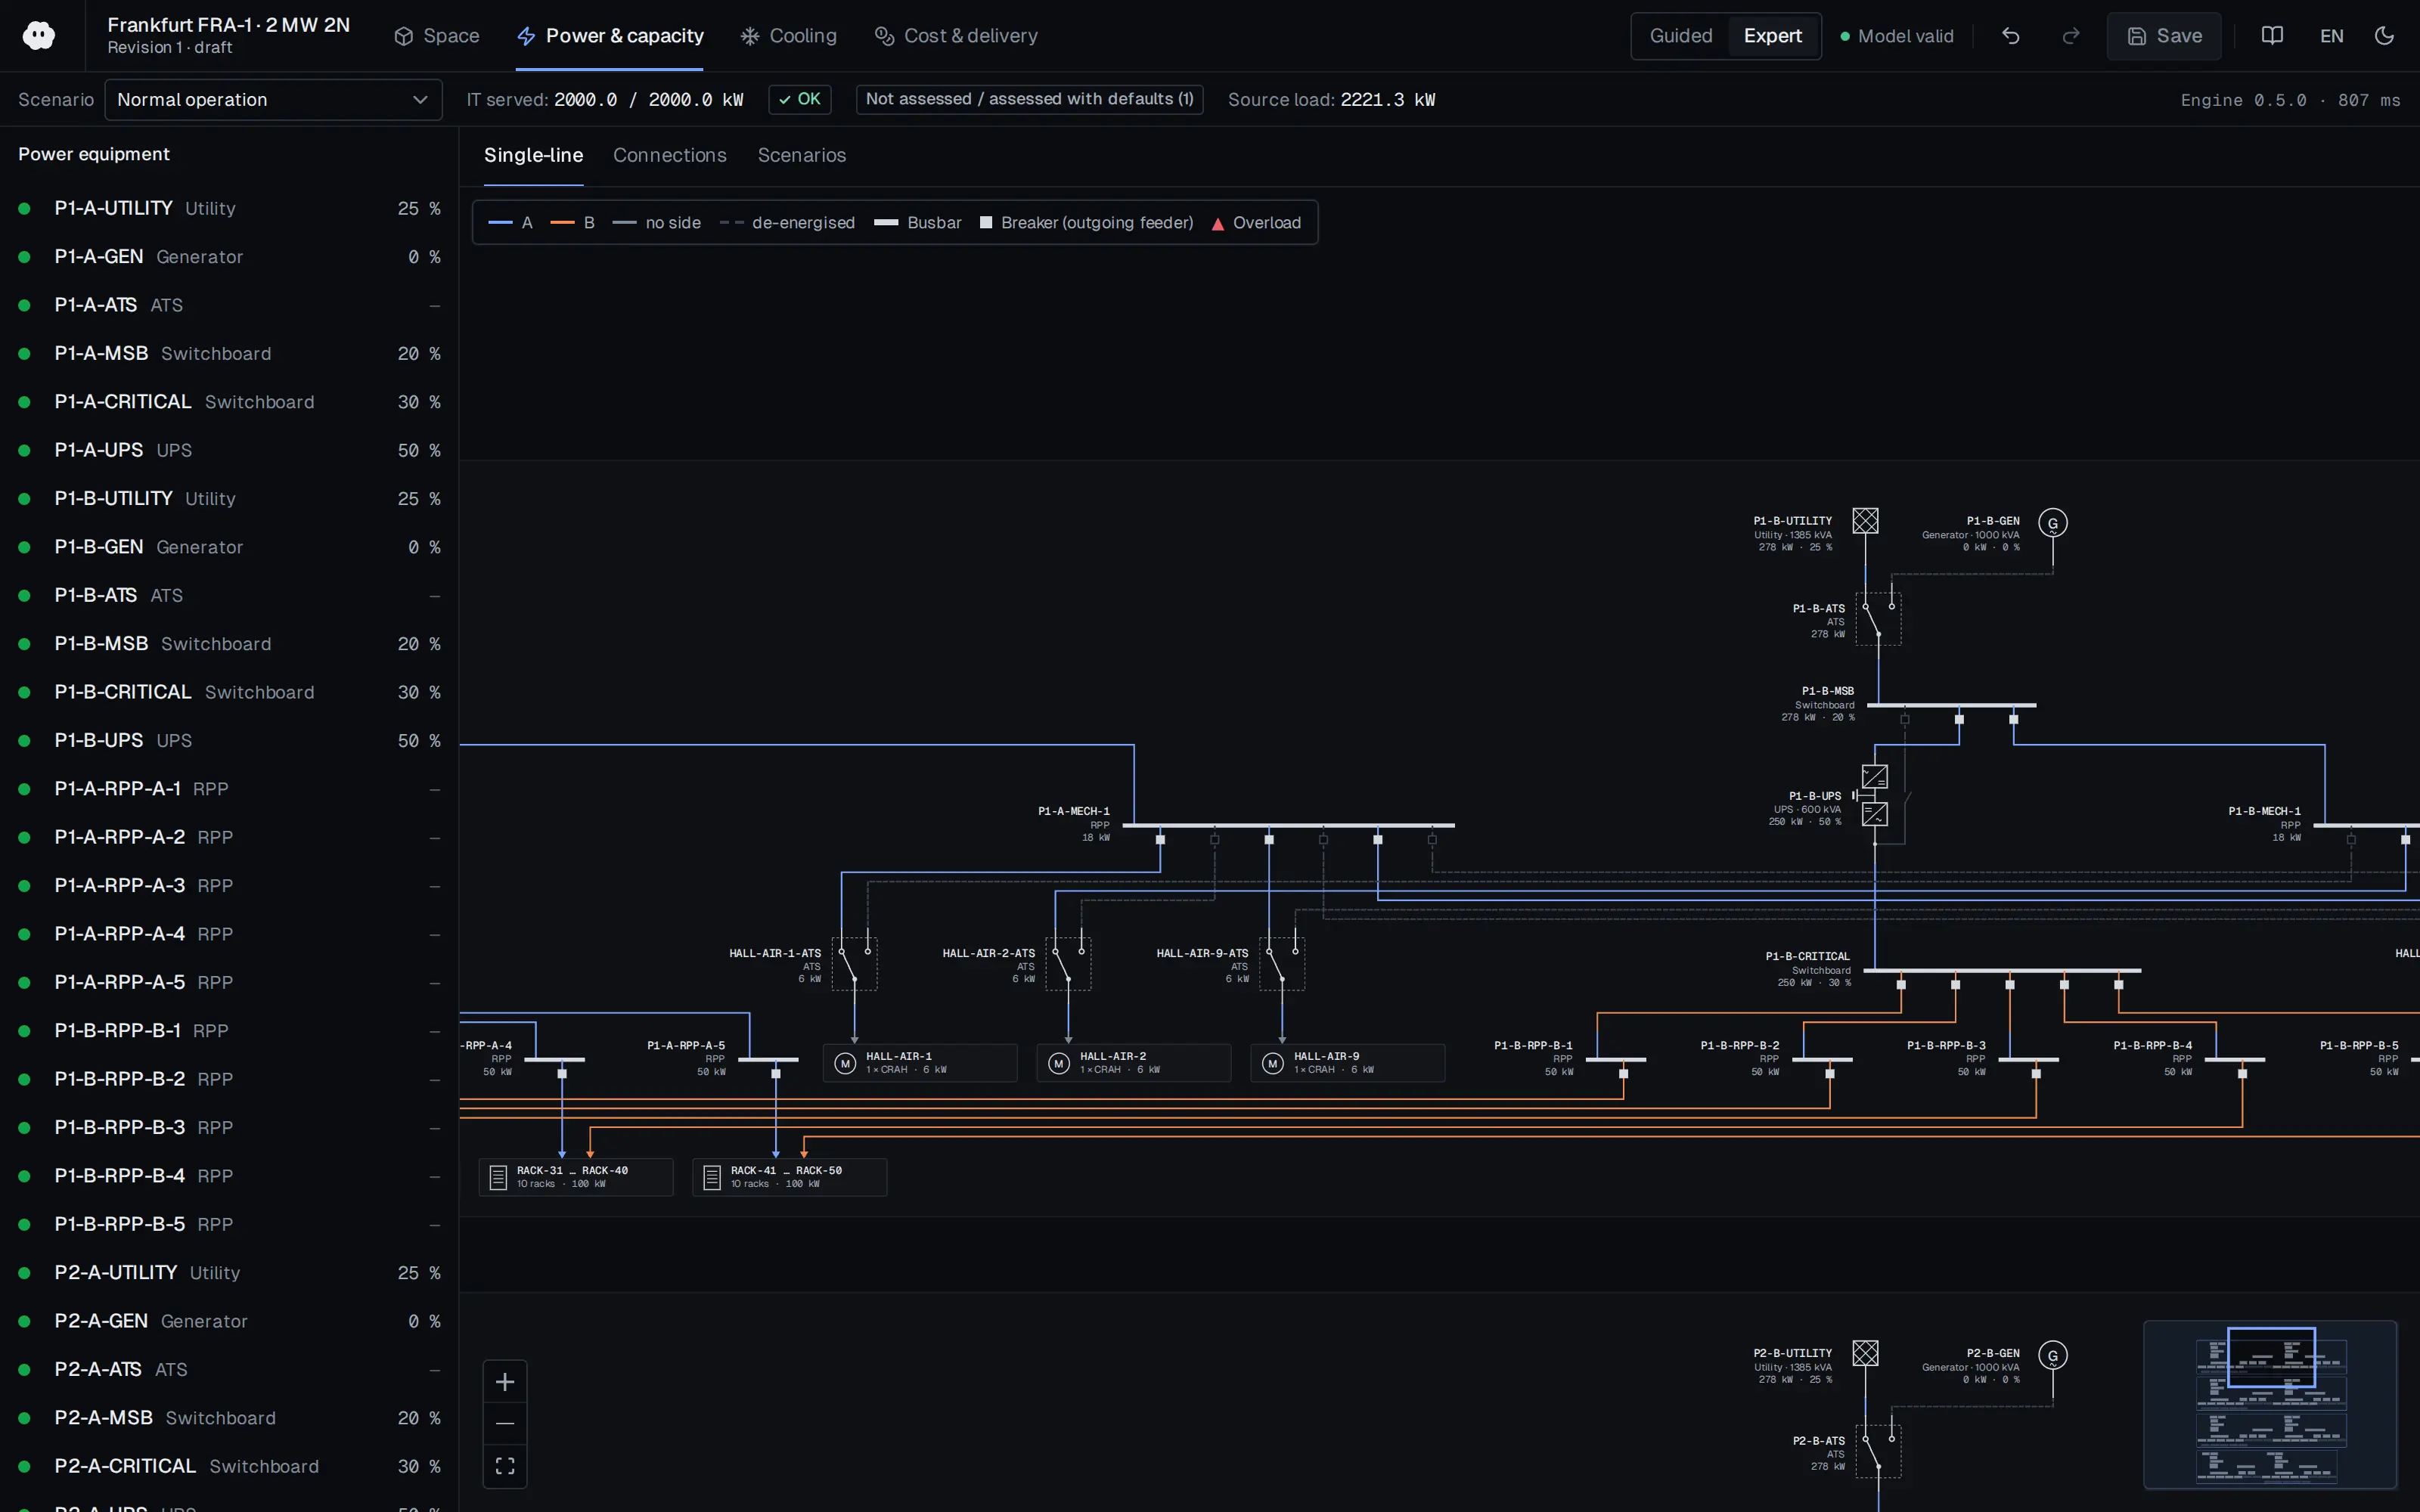
Who should read it
Power-system engineers and reliability analysts comparing DRUPS and UPS configurations at early design stage.
Document contents
- 1. Introduction
- 2. State-of-the-Art and Proposed Methods for Reliability Assessment (2.1 Reliability Block Diagram, 2.2 Informational Analysis Concept)
- 3. Use Cases (3.1 General, six power supply system configurations)
- 4. Results (reliability indicators and informational indicators, comparison)
- 5. Discussion
- 6. Conclusions
Related standards
- IEC 61078:2016
Read the document
drups-configuration-reliability-2023.pdf
CC BY 4.0 — share with attribution
The document is provided unaltered because its licence permits redistribution.
Publication details
- Authors
- Kirill Varnavskiy; Fedor Nepsha; Qingguang Chen; Alexander Ermakov; Sergey Zhironkin
- Publisher
- Energies (MDPI AG)
- Year
- 2023
- Volume
- 16
- Issue
- 3
- Pages
- 1419
- Document language
- English
- Source type
- Scientific
- Access
- Open licence — downloadable
- Licence
- CC BY 4.0 — share with attribution
- Licence evidence
- www.mdpi.com
Original licence note
Page 1 states the article is distributed under the terms and conditions of the Creative Commons Attribution (CC BY) license (creativecommons.org/licenses/by/4.0/).
Citation
Kirill Varnavskiy; Fedor Nepsha; Qingguang Chen; Alexander Ermakov; Sergey Zhironkin (2023). Reliability Assessment of the Configuration of Dynamic Uninterruptible Power Sources: A Case of Data Centers. Energies (MDPI AG). 16(3), 1419. https://doi.org/10.3390/en16031419
Events on this subject
- Electricity Eurasia 2027
- ELECO 2026 Elektrik-Elektronik ve Biyomedikal Mühendisliği Konferansı
- ICCI 2027 – Uluslararası Enerji ve Çevre Fuarı ve Konferansı
All content and rights belong to the respective authors and publishers. SoSo CAD provides only the citation, its own summary and a link to the source, and is not responsible for the sources' content.
Related sources
All sources on this topic
U.S. DoD (UFC) 2023
UFC 3-540-01 Engine-Driven Generator Systems for Prime and Standby Power Applications (1 August 2014, Change 3, 26 January 2023)
Include transient and steady-state loads, transformer inrush, motor starting and UPS load in the generator sizing study, and calculate UPS charging load using the minimum charging current allowed while on generator.
- Harmonic analysis is required when switching power supplies make up 25% or more of the system load.

FEMA 2014
FEMA P-1019, Emergency Power Systems for Critical Facilities: A Best Practices Approach to Improving Reliability (September 2014)
At critical-facility data centers, place generators, ATS, fuel tanks and pumps above the greatest of BFE + 3 ft, DFE + 1 ft and 500-year elevation + 1 ft, and prefer elevation to dry floodproofing.
- Generators over 300 kW are almost exclusively diesel-fueled.

Headquarters, Department of the Army (U.S. Army Corps of Engineers PREP) 2006
TM 5-698-5 Survey of Reliability and Availability Information for Power Distribution, Power Generation, and Heating, Ventilating and Air Conditioning (HVAC) Components for Commercial, Industrial, and Utility Installations (22 July 2006)
When modelling the power and cooling chain use these values as starting failure rates and MTBF/MTTR inputs and convert them into availability with the method of TM 5-698-1.
- Diesel engine generators overall: 0.528 failures/yr, MTBF about 16,590 h, MTTR 24.22 h, operational availability 0.99399.
Consulting-Specifying Engineer 2026
Know the electrical, power components in a data center
Seed facility-type templates with default UPS/generator redundancy and fuel autonomy from Table 1.
- Generators should be loaded to at least 30% to avoid wet stacking.
Uptime Institute 2026
Uptime Institute Annual Outage Analysis 2026 (8th annual) — press release (with 2025 findings)
Weight UPS, ATS/STS and generator failure modes highest in the reliability model
- About 1 in 10 outages has serious or severe impact
Eaton 2025
Data Center as a Good Grid Citizen
Add grid-code parameters to the utility connection object: UFLS stages, LVRT curve, post-fault power recovery ramp (%/s) and short-circuit ratio at the PCC.
- Typical BESS Li-ion cells are limited to about 1C discharge.