
Measuring energy and water efficiency for Microsoft datacenters
Microsoft
Microsoft's public page defines PUE and WUE as it uses them and reports fleet and regional values for owned datacenters operational for 12 months. It shows with numbers how climate drives regional differences.
On this page
Overview
Global PUE is 1.16 in FY24 and 1.17 in FY25; WUE is 0.30 in FY24 and 0.27 L/kWh in FY25. In the regional table the Americas have PUE 1.16 in both years and WUE 0.38 and 0.34 L/kWh, while Asia Pacific shows PUE 1.25 and 1.28. That gap of roughly 0.1 in PUE reflects the same design spending more cooling energy in a hot, humid climate.
The WUE definition is narrow: annual water for humidification and cooling (litres) divided by annual IT energy (kWh). The scope is limited too: only fully owned or controlled datacenters operational for at least 12 months enter the table. The page notes that values improve as sites reach full capacity and that climate (humidity, ambient temperature) creates the regional differences. The Americas' WUE falling from 0.38 to 0.34 shows regional water efficiency can move within one year.
The small rise in global PUE from 1.16 to 1.17 shows the fleet average does not improve every year and also depends on the regional mix. The page also carries a goal: by 2030, 100% of electricity matched by zero-carbon purchases 100% of the time. The values belong to one company's fleet and are regional averages, so they cannot be a target for a single facility. Read next to ISO/IEC 30134-2 (PUE) and 30134-9 (WUE), it is a good example for comparing measurement boundaries.
Key points
- Global PUE 1.16 (FY24) and 1.17 (FY25); WUE 0.30 (FY24) and 0.27 L/kWh (FY25).
- Americas PUE 1.16/1.16, WUE 0.38/0.34; Asia Pacific PUE 1.25/1.28 (FY24/FY25).
- WUE = annual water for humidification and cooling (L) / annual IT energy (kWh).
- Includes only fully owned/controlled datacenters operational for at least 12 months.
- Target: 100% of electricity matched by zero-carbon purchases 100% of the time by 2030.
- Climate drives regional differences; values improve as sites reach full capacity.
Using it in design
- Expose climate-driven partial PUE/WUE in site comparison; flag that hot-humid regions (e.g. APAC tropics) give about 0.1 higher PUE for the same design.
- In the WUE calculator default the scope to cooling and humidification water only (Microsoft-style), with an option to include domestic water.
- Footnote the measurement boundary (12 months, owned facilities) wherever these values appear in comparison tables.
Monthly newsletter · free
Keep your reading list current
Once a month: new library sources, changes to Turkish regulations and upcoming data centre events.
SoSo CAD
Compare the cost of design decisions
Evaluate equipment costs, energy expenses and total cost of ownership (TCO) using your inputs and assumptions in SoSo CAD.
Request a demo
Who should read it
Designers and sustainability analysts benchmarking PUE and WUE targets who need measurement boundaries defined correctly.
Related standards
- ISO/IEC 30134-2
- ISO/IEC 30134-9
Publication details
- Authors
- Microsoft
- Publisher
- Microsoft
- Year
- 2025
- Document language
- English
- Source type
- Expert / community
- Access
- Free to read
- Licence
- Copyright retained; citation only — the publisher’s terms apply to the original document
Citation
Microsoft (2025). Measuring energy and water efficiency for Microsoft datacenters. Microsoft. https://datacenters.microsoft.com/sustainability/efficiency/
Events on this subject
Browse the events calendarAll content and rights belong to the respective authors and publishers. SoSo CAD provides only the citation, its own summary and a link to the source, and is not responsible for the sources' content.
Related sources
All sources on this topic
European Commission 2026
Report from the Commission to the European Parliament and the Council on the energy efficiency of data centres in the EU - COM(2026) 500 final
Set the PUE target for new designs against the bands in the report (below 1.2 excellent, above 1.5 needs improvement) and possible future minimum-standard thresholds, noting that the 500-1000 kW class averaged 1.64.
- EU data centres consumed 68 TWh of electricity in 2024, expected to reach 114 TWh by 2030 (3.2% of EU electricity).
European Commission 2026
Annexes 1 to 3 to Commission Delegated Regulation C(2026) 3472 - EU data centre energy (PUE) and water (WUE) efficiency classes, data centre label, and amendments to Delegated Regulation (EU) 2024/1364
Translate PUE and WUE targets into A-G classes: class A needs a design PUE of 1.15 or below and WUE of 0.1 or below; the class D boundary is 1.5 and 0.6. Write the class target into the design specification.
- WUE classes: A <= 0.1; B 0.1-0.2; C 0.2-0.4; D 0.4-0.6; E 0.6-0.8; F 0.8-1.0; G > 1.0.
European Commission 2026
Commission Delegated Regulation C(2026) 3472 of 21.9.2026 supplementing Directive (EU) 2023/1791 and amending Delegated Regulation (EU) 2024/1364 as regards the establishment of a common Union rating scheme for data centres (main act)
As labels will be issued every year from 15 August 2027, set PUE and WUE class targets (Annex I) at design stage for new and existing sites and build the metering infrastructure to the reporting requirements.
- Labels are generated automatically by the European database every year from 15 August 2027 and are publicly available electronically in all official Union languages.
European Commission, DG Energy 2025
Assessment of the energy performance and sustainability of data centres in EU - First technical report (July 2025)
Compare your design PUE target with the real EU spread: 1.21 on average above 10 MW, 1.55 at 1-2 MW; set a realistic bound for your facility size.
- Rule of thumb cited: PUE below 1.2 excellent, 1.2-1.5 good, above 1.5 room for improvement.
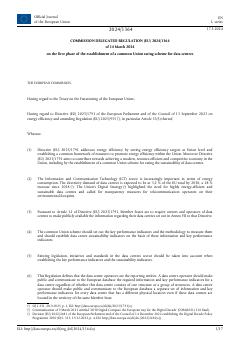
European Commission (Official Journal of the European Union) 2024
Commission Delegated Regulation (EU) 2024/1364 of 14 March 2024 on the first phase of the establishment of a common Union rating scheme for data centres
Build the metering architecture to the regulation: meters on every supply input for total energy (grid and back-up generator separately) and at every UPS output for IT energy, with a system that retains measurement point and device records for at least 10 years.
- Data centre electricity demand is projected to reach 3.2% of total EU demand by 2030, a 28% increase over 2018.
Open Compute Project Foundation 2024
Data Center Facility Sustainability Metrics (OCP Data Center Facility white paper, October 2, 2024)
Build the metering plan so that PUE can be reported at the highest category possible, with IT load measured at PDU or equipment input rather than the UPS output where feasible.
- External reporting is annual (required) and quarterly on a trailing 12 months (recommended); internal tracking should be continuous or monthly.