
CFD Modeling of Pressure Drop through an OCP Server for Data Center Applications
Energies (MDPI AG) · Aras Dogan, Sibel Yilmaz et al.
A reduced (compact) server model for room-level CFD: pressure-drop curves of a fully resolved Open Compute Project server in a virtual wind tunnel are fitted with Darcy-Forchheimer coefficients for a porous block that needs only about 0.3% of the cells.
CC BY 4.0 — share with attribution
On this page
Overview
The study asks how to calculate quickly and accurately the turbulent pressure drop that internal components cause in servers in air-cooled data-centre simulations. A fully resolved Open Compute Project (OCP) server was run in OpenFOAM in a virtual wind tunnel (5.98 million cells, k-omega SST) over a range of airflows, with fans stationary (inactive) and with fans included (active). The tunnel inlet was 0.5 L upstream and the outlet L downstream of the server (L = server length), with 5% inlet turbulence intensity and slip side walls.
The fully resolved snappyHexMesh model had 5.98 million cells; the porous replacement used a 20,352-cell block mesh, about 0.3% of that. Twenty simulations were run for flow rates of 0.003 to 0.06 m³/s, and steady-state results matched time-averaged transient results. Fitted Darcy-Forchheimer coefficients were: inactive server D = 782,803.905 and F = 37.395; active server D = 715,633.617 and F = 24.788. The main pressure losses occur at the inlet, at the rear heat sink and at the fans/outlet, which gives the highest drop.
A literature approach assuming porosity 0.5 and hydraulic diameter 0.55 departed strongly from the resolved pressure-drop curve, so the choice of porosity coefficients drives accuracy. The porous-versus-complete uncertainty index was largest at low flow, 0.6699 (inactive) and 0.3725 (active) at 0.003 m³/s, and fell to 0.0451 (inactive) and 0.1329 (active) at 0.06 m³/s. The authors publish both the coefficients and the OpenFOAM cases.
Limits: the coefficients are specific to one OCP server design and must be re-derived for another server geometry; uncertainty of the porous model is high at low flow, and the study treats pressure drop only, with thermal modelling out of scope.
Key points
- The virtual wind tunnel inlet was 0.5 L upstream and the outlet L downstream of the server (L = server length), with 5% inlet turbulence intensity and slip side walls.
- The fully resolved snappyHexMesh model had 5.98 million cells; the porous replacement used a 20,352-cell block mesh, about 0.3% of that.
- Twenty simulations were run for flow rates of 0.003 to 0.06 m³/s, and steady-state results matched time-averaged transient results.
- Fitted Darcy-Forchheimer coefficients: inactive server D = 782,803.905 and F = 37.395; active server D = 715,633.617 and F = 24.788.
- A literature approach assuming porosity 0.5 and hydraulic diameter 0.55 departed strongly from the resolved pressure-drop curve, so the choice of porosity coefficients drives accuracy.
- Porous-versus-complete uncertainty index was largest at low flow, 0.6699 (inactive) and 0.3725 (active) at 0.003 m³/s, falling to 0.0451 (inactive) and 0.1329 (active) at 0.06 m³/s.
- The main pressure losses occur at the inlet, at the rear heat sink and at the fans/outlet, which gives the highest drop.
Using it in design
- When modelling a server as a porous block in room-scale CFD, use Darcy-Forchheimer coefficients fitted to a resolved pressure-drop curve rather than generic assumptions such as porosity 0.5.
- Use separate coefficients for servers with fans running (active) and stationary (inactive) (D = 715,633.617 and 782,803.905), and note that uncertainty is high at low flow.
- Cut server cell count to about 0.3% of the full geometry to make solving many servers in a room model practical.
Monthly newsletter · free
Keep your reading list current
Once a month: new library sources, changes to Turkish regulations and upcoming data centre events.
SoSo CAD
Check cooling capacity alongside your design
Review zone heat loads, available capacity and the capacity balance after the largest unit is lost in SoSo CAD.
Request a demo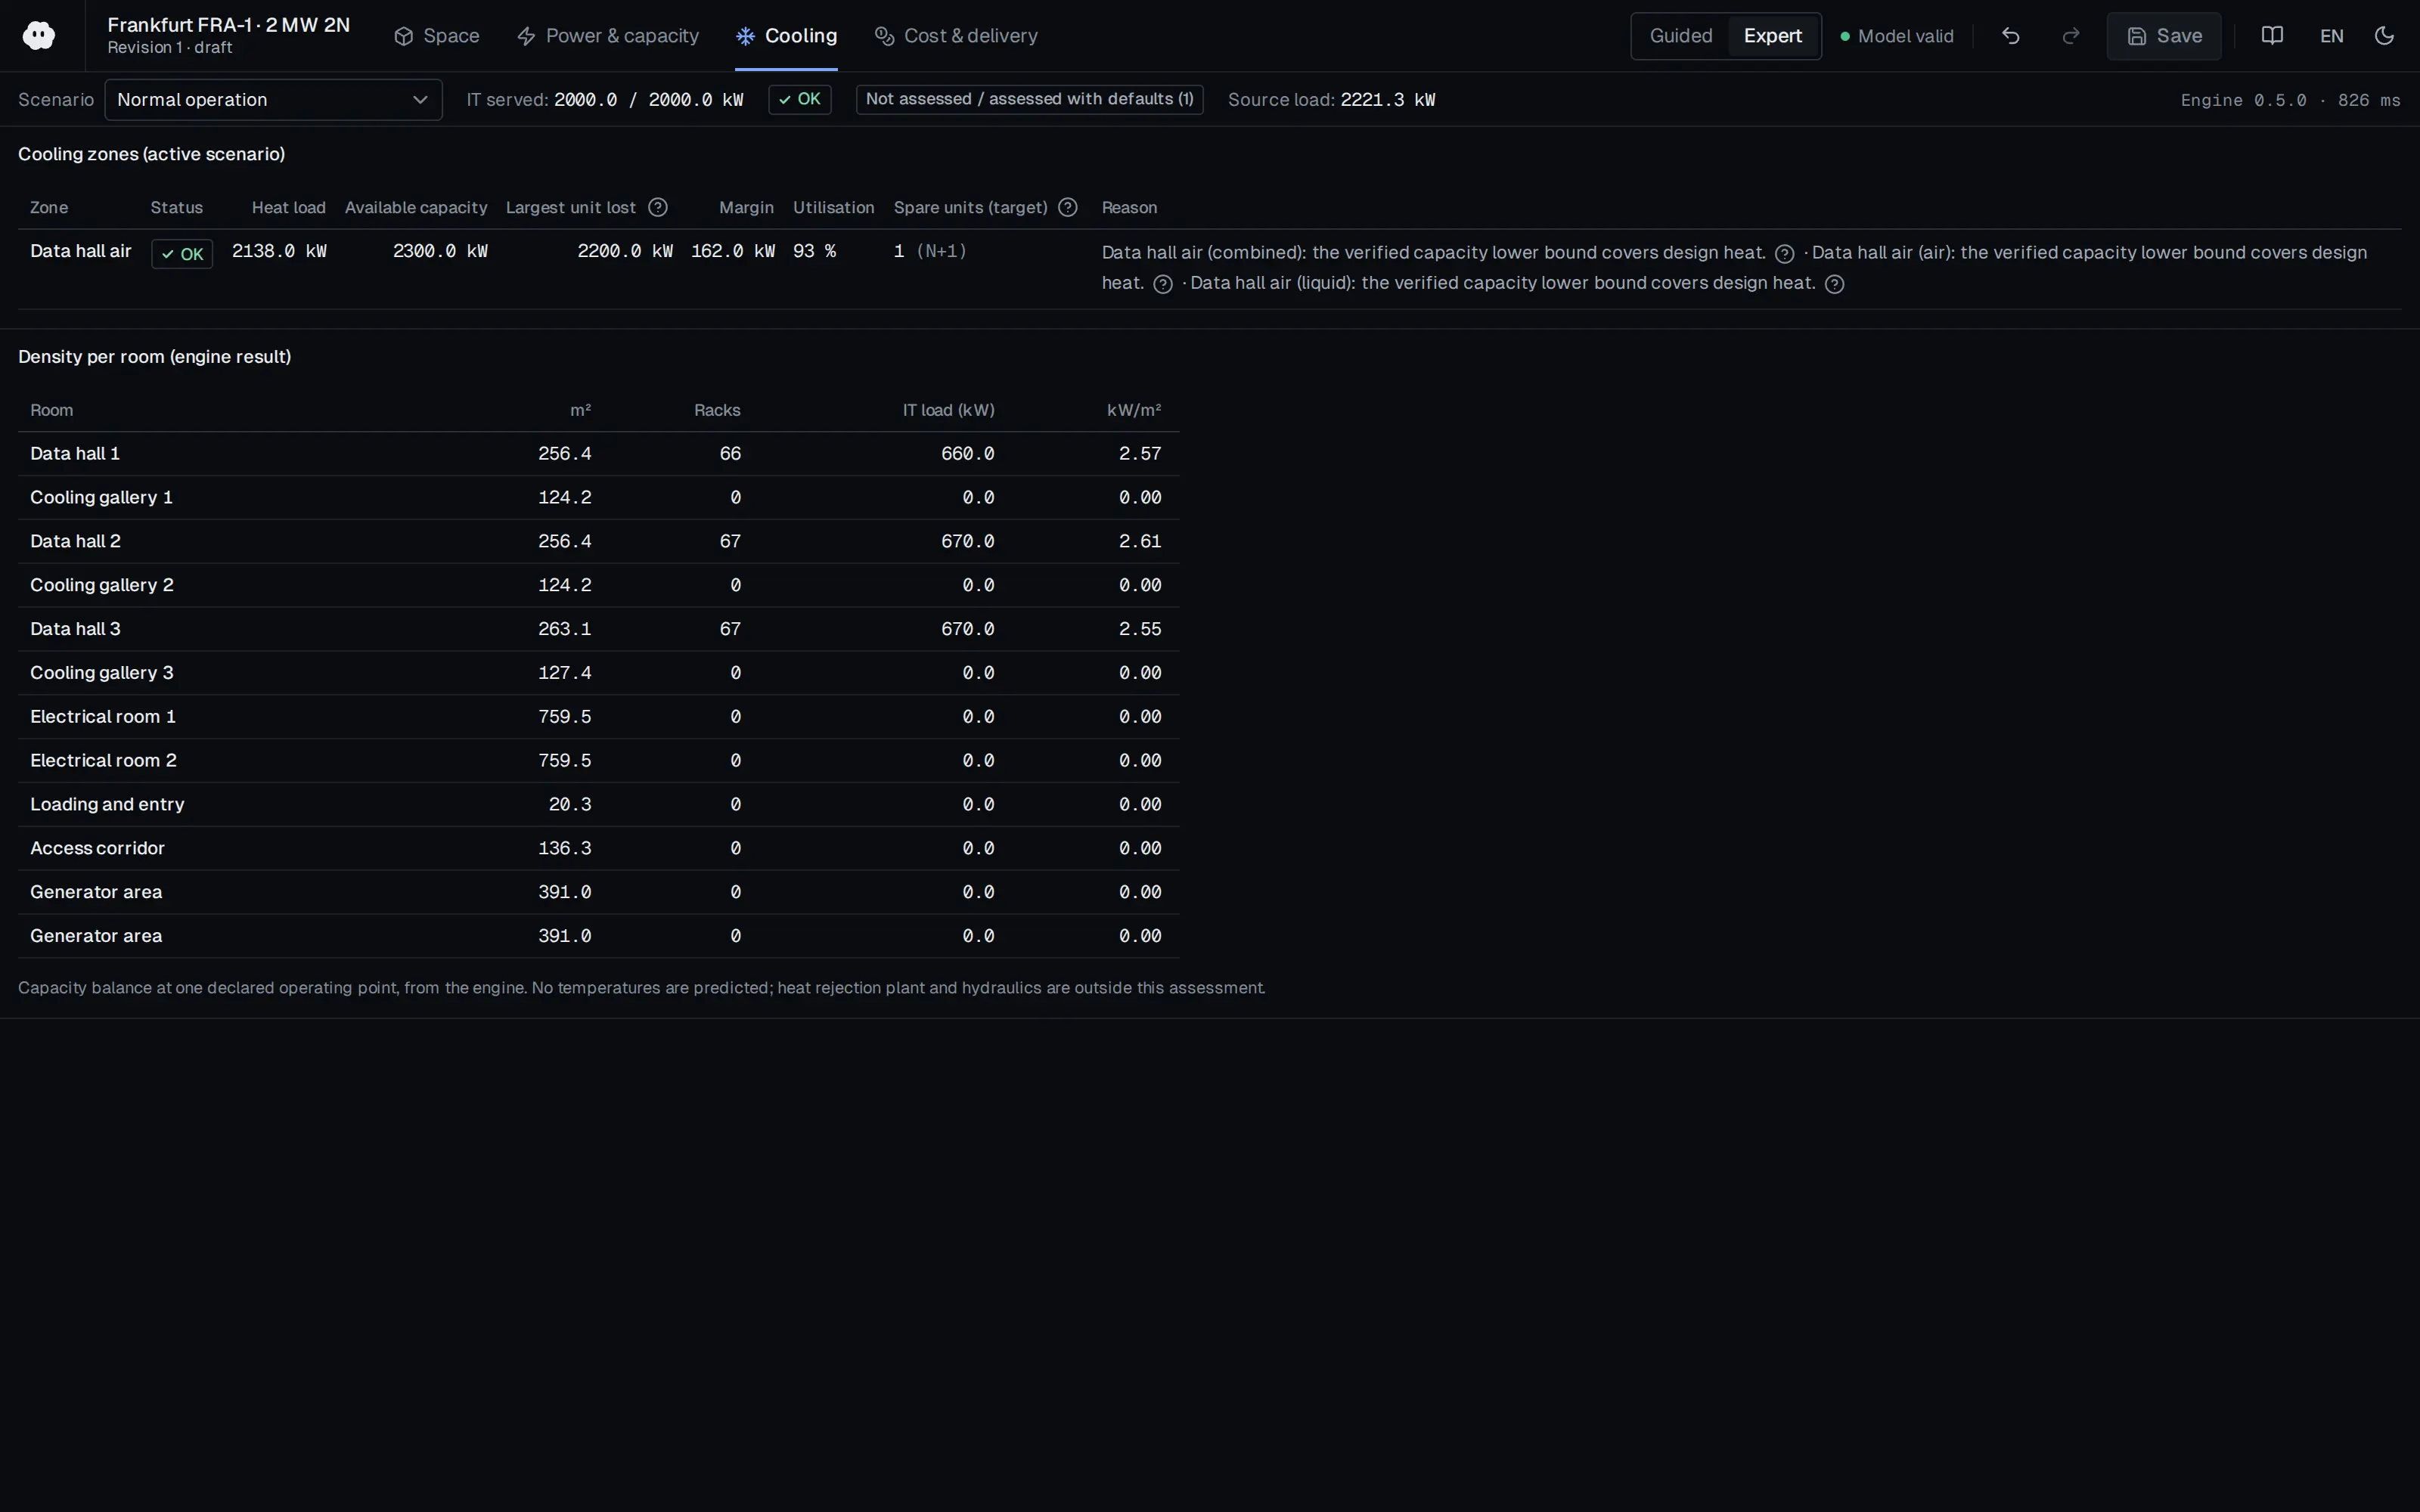
Who should read it
Data-centre thermal engineers and researchers building server models for room-scale CFD.
Document contents
- 1. Introduction
- 2. Methods (2.1 Governing Equations, 2.2 Computational Domain, Boundary Conditions and Mesh, 2.3 Numerical Method)
- 3. Results (validation, time-averaging, inlet conditions)
- 4. Conclusions
Related standards
- OCP Open Rack
Read the document
ocp-server-pressure-drop-cfd-2022.pdf
CC BY 4.0 — share with attribution
The document is provided unaltered because its licence permits redistribution.
Publication details
- Authors
- Aras Dogan; Sibel Yilmaz; Mustafa Kuzay; Cagatay Yilmaz; Ender Demirel
- Publisher
- Energies (MDPI AG)
- Year
- 2022
- Volume
- 15
- Issue
- 17
- Pages
- 6438
- Document language
- English
- Source type
- Scientific
- Access
- Open licence — downloadable
- Licence
- CC BY 4.0 — share with attribution
- Licence evidence
- www.mdpi.com
Original licence note
PDF p.1: Licensee MDPI; open access article distributed under the terms and conditions of the Creative Commons Attribution (CC BY) license.
Citation
Aras Dogan; Sibel Yilmaz; Mustafa Kuzay; Cagatay Yilmaz; Ender Demirel (2022). CFD Modeling of Pressure Drop through an OCP Server for Data Center Applications. Energies (MDPI AG). 15(17), 6438. https://doi.org/10.3390/en15176438
Events on this subject
- SC26 – International Conference for High Performance Computing, Networking, Storage and Analysis
- ASHRAE Winter Conference
- AHR Expo
All content and rights belong to the respective authors and publishers. SoSo CAD provides only the citation, its own summary and a link to the source, and is not responsible for the sources' content.
Related sources
All sources on this topic
Applied Sciences (MDPI AG) 2024
Numerical Evaluation of Hot Air Recirculation in Server Rack
Make hot-aisle back pressure (hot-aisle pressure above cold aisle) a design input in contained aisles; server inlet temperature rises once back pressure reaches the fans' free-delivery point.
- A three-grid GCI study (1.22 to 1.99 million cells) selected a 1,799,871-cell trimmed hexahedral mesh with seven prism layers, near-wall y+ of about 5.
Buildings (MDPI AG) 2023
Numerical Investigation of Thermal Performance with Adaptive Terminal Devices for Cold Aisle Containment in Data Centers
For hot-spot removal, before choosing lower supply temperature or higher airflow outright, compare the COP drop (3.2 to 2.6) and the energy difference (20.1% and 4.2%) with a rack-specific air distribution option.
- A grid study at 260,000 to 1,340,000 cells showed results stabilising at about 560,000 cells.
Energies (MDPI AG) 2023
Conjugate Heat Transfer Modeling of a Cold Plate Design for Hybrid-Cooled Data Centers
In hybrid-cooled racks, represent a cold-plate server as a compact model in room-scale CFD: model the share of CPU heat going to the cold plate (~97%) and the residual escaping to air separately.
- A cited micro data centre with 1.2 kW IT capacity reached a maximum outlet water temperature of approximately 50 °C.

Open Compute Project Foundation 2026
Open Data Center: Next-Generation ML Infrastructure Design Principles, Revision 0.7.0 (Design Specification, effective Aug 27, 2026)
Base floor and transport-route load checks on the 8,000 lb rack and the 15,000 lb rack-plus-sidecar combination, and include the weight of the moving equipment.
- Available quick connects currently top out at 2 in.
Frontiers in Heat and Mass Transfer (Tech Science Press) 2026
Evaluation of Local Thermal Environment in Operational Data Center
Before adding servers to an existing hall, measure the local thermal environment of the target rack in place with server simulators and score it with IOM; RCI, SHI or RTI average away within-rack non-uniformity.
- Removing blanking plates raised IOM by 31%, 358%, 718%, 84% and 85% across the five layouts, with inlet temperatures up by as much as 29%; in two layouts IOM exceeded 2.0.
Frontiers in Energy Research (Frontiers Media SA) 2023
Performance evaluation and modeling of active tile in raised-floor data centers: An empirical study on the single rack
With active tiles, always seal under-rack gaps; if left open, low pressure at the tile surface pulls hot air in under the rack and worsens the lower servers.
- CRACs were set to 21 °C but delivered 23 °C supply, and thermal load was about 65% of cooling capacity, so one CRAC was off.