
Evaluation of Local Thermal Environment in Operational Data Center
Frontiers in Heat and Mass Transfer (Tech Science Press) · Yan Xiao, Ruoyi Xie et al.
A method for checking the local thermal environment before adding servers to an existing hall: 2U server simulators were placed in a test rack in a live, uncontained 650 m² raised-floor hall in Hangzhou, ten layout cases were measured and scored with the Index of Mixing (IOM).
CC BY 4.0 — share with attribution
On this page
Overview
When redeploying servers or installing new racks in an existing data centre, assessing whether target areas meet stringent cooling requirements is crucial, yet limited research addresses it. The authors built a 2U server simulator (675 W maximum, adjustable fans and heaters) and placed four in a test rack. The facility is about 650 m² with a 3.6 m ceiling, a 0.7 m plenum, eight uncontained rows (four cold and five hot aisles) and fifteen CRACs. Each 2U simulator measures 550 × 435 × 88.9 mm with three Delta PFB0812UHE fans, a PSU fan and six heaters; the rack was instrumented with 10 inlet and 30 outlet T-type thermocouples on frames 5 cm from the rack faces.
IOM is defined from the maximum and minimum rack inlet temperatures and the mean outlet and inlet temperatures, and values above 1 indicate exhaust recirculation; it picks up within-rack non-uniformity that RCI, SHI or RTI average away. With blanking, placing all four servers at the bottom of the rack gave the lowest IOM (0.28). Removing blanking plates raised IOM by 31%, 358%, 718%, 84% and 85% across the five layouts, and inlet temperatures at the same points rose by up to 29%; in two layouts IOM exceeded 2.0.
The local CFD domain was 2.2 × 1.8 × 2.15 m (three racks, 0.6 m aisles, 0.15 m overhead gap, a 0.05 m floor gap behind the rack); previous work shows three-rack models are more accurate than single-rack models. A three-rack local Icepak model, with servers as porous media calibrated to the simulator, reproduced the measured inlet profiles within a few percent: maximum inlet deviation was 3.31% in Case A, and 6.91% (inlet) and 8.61% (outlet) in Case B, with the largest outlet deviation 14.49%, attributed to surrounding hall effects and floor-gap leakage.
Limits: four servers under partial load and a single test rack; the local model does not fully capture the surrounding hall's influence and floor-gap leakage. The work supports local CFD sub-models plus simulator testing for brownfield deployments.
Key points
- The facility is about 650 m² with a 3.6 m ceiling, a 0.7 m plenum, eight uncontained rows (four cold and five hot aisles) and fifteen CRACs; supply grilles are 0.6 × 0.6 m louvered (effective area 0.52 × 0.3 m, 60 degree discharge angle).
- Each 2U simulator measures 550 × 435 × 88.9 mm with three Delta PFB0812UHE fans, a PSU fan and six heaters (675 W maximum); the rack had 10 inlet and 30 outlet T-type thermocouples.
- IOM is defined from maximum and minimum rack inlet temperatures and mean outlet and inlet temperatures; values above 1 indicate exhaust recirculation. With blanking, all four servers at the bottom of the rack gave the lowest IOM (0.28).
- Removing blanking plates raised IOM by 31%, 358%, 718%, 84% and 85% across the five layouts, with inlet temperatures up by as much as 29%; in two layouts IOM exceeded 2.0.
- The local CFD domain was 2.2 × 1.8 × 2.15 m (three racks, 0.6 m aisles, 0.15 m overhead gap, 0.05 m floor gap behind the rack); three-rack models are more accurate than single-rack models.
- Validation: maximum inlet deviation was 3.31% in Case A, and 6.91% (inlet) and 8.61% (outlet) in Case B; the largest outlet deviation was 14.49%, attributed to surrounding hall effects and floor-gap leakage.
Using it in design
- Before adding servers to an existing hall, measure the local thermal environment of the target rack in place with server simulators and score it with IOM; RCI, SHI or RTI average away within-rack non-uniformity.
- In a partly filled rack, place servers in the lower section (IOM 0.28) and close unused rack spaces with blanking plates; without panels IOM rose by 31-718%.
- For brownfield deployments, use a three-rack local CFD sub-model (servers as porous media calibrated to the simulator) with measurement validation, and allow for the largest deviation (14.49% outlet) coming from floor-gap leakage.
Monthly newsletter · free
Keep your reading list current
Once a month: new library sources, changes to Turkish regulations and upcoming data centre events.
SoSo CAD
Check cooling capacity alongside your design
Review zone heat loads, available capacity and the capacity balance after the largest unit is lost in SoSo CAD.
Request a demo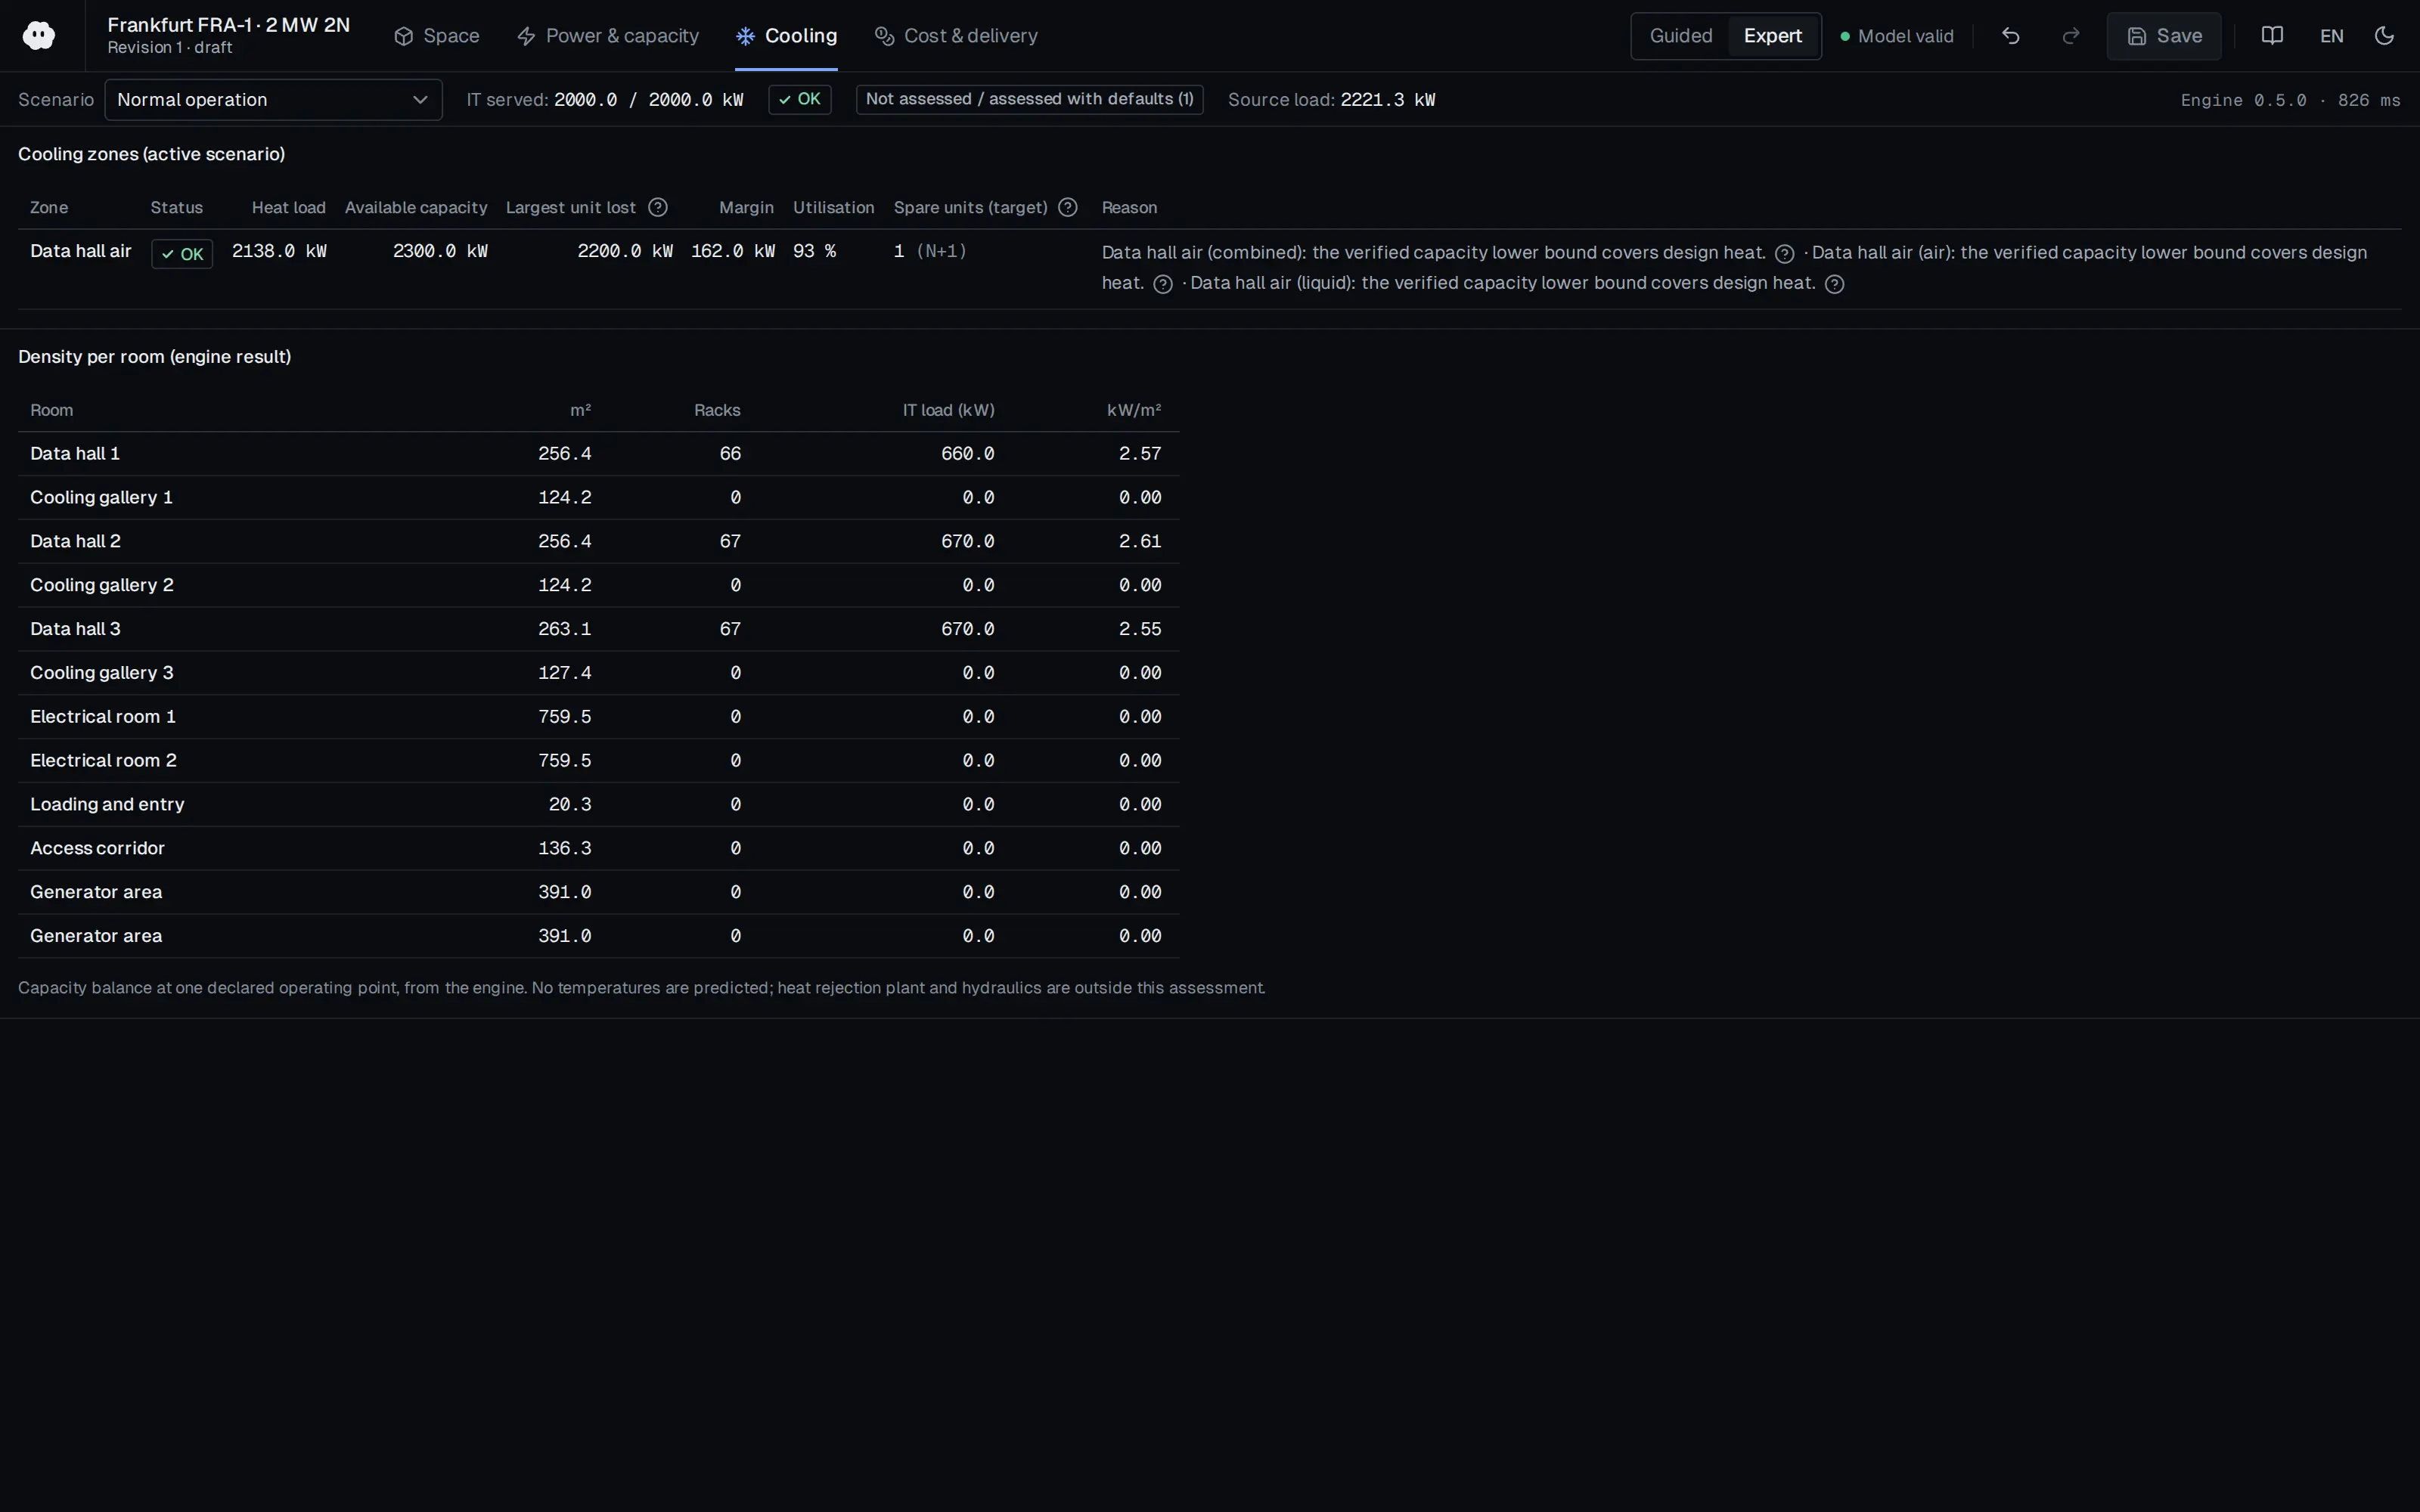
Who should read it
Operations and cooling engineers adding servers or rearranging racks in existing halls.
Document contents
- 1 Introduction
- 2 Methodology (2.1 Data Center Description, 2.2 Experimental Study, 2.3 Numerical Simulation)
- 3 Results and Discussion (3.1 Effect of Server Layout and Blind Plates, 3.2 Rack Thermal Environment Simulation, 3.3 Local CFD Model Validation)
- 4 Conclusion
Related standards
- ASHRAE TC 9.9 Thermal Guidelines for Data Processing Environments
Read the document
operational-dc-local-thermal-env-2026.pdf
CC BY 4.0 — share with attribution
The document is provided unaltered because its licence permits redistribution.
Publication details
- Authors
- Yan Xiao; Ruoyi Xie; Song Gao; Jinhui Yang; Luyao Liang; Shaozhi Zhang
- Publisher
- Frontiers in Heat and Mass Transfer (Tech Science Press)
- Year
- 2026
- Volume
- 24
- Issue
- 4
- Pages
- 1-10
- Document language
- English
- Source type
- Scientific
- Access
- Open licence — downloadable
- Licence
- CC BY 4.0 — share with attribution
- Licence evidence
- www.techscience.com
Original licence note
PDF p.1: Copyright 2026 The Authors. Published by Tech Science Press. Licensed under a Creative Commons Attribution 4.0 International License.
Citation
Yan Xiao; Ruoyi Xie; Song Gao; Jinhui Yang; Luyao Liang; Shaozhi Zhang (2026). Evaluation of Local Thermal Environment in Operational Data Center. Frontiers in Heat and Mass Transfer (Tech Science Press). 24(4), 1-10. https://doi.org/10.32604/fhmt.2026.077396
Events on this subject
Browse the events calendarAll content and rights belong to the respective authors and publishers. SoSo CAD provides only the citation, its own summary and a link to the source, and is not responsible for the sources' content.
Related sources
All sources on this topic
Open Compute Project Foundation 2026
Open Data Center: Next-Generation ML Infrastructure Design Principles, Revision 0.7.0 (Design Specification, effective Aug 27, 2026)
Base floor and transport-route load checks on the 8,000 lb rack and the 15,000 lb rack-plus-sidecar combination, and include the weight of the moving equipment.
- Available quick connects currently top out at 2 in.
Open Compute Project Foundation 2026
Whitepaper: Thermal Boundaries in AI Infrastructure - Matching cooling technologies to compute through the power inflection, Version 1.00 (October 2026)
Choose cooling architecture against target rack power and each method's usable envelope: a 45 kW air ceiling (60-80 kW with rear doors), 120-250 kW class cold-plate racks, and the paper's anchor values for announced 600 kW-class racks.
- Practical air-cooled rack ceiling is taken as 45 kW, extendable to about 60-80 kW with rear-door heat exchangers.

Open Compute Project Foundation 2026
OCP Cooling Environments: Cold Plate Sub-Project Design Specification, Universal Quick Disconnect (UQD), v2.0.0 (effective September 22, 2026)
Select size (02-08) by rack or server loop flow: rated flows run from 2.27 to 17.79 L/min; estimate pressure drop from the Cv range and ask for correction or extra testing where the fluid differs from water.
- Cv ranges: 0.30-0.43 for size 02, 1.1-1.6 for 04, 2.2-3.3 for 06 and 3.6-5.6 for 08.

Open Compute Project Foundation 2025
Modular Technology Cooling System for "Cloud Scale": Design & Delivery of Liquid to Rack Distribution Systems, Version 1.0 (25 August 2025)
When sizing TCS capacity against electrical capacity, state the cold-plate capture fraction (70-80%) and target delta-T (10 or 20 C) explicitly, and use the roughly doubled delivery at 20 C (4,845 versus 2,422 kW) as design headroom.
- Most IT equipment is designed for a 10 C coolant delta-T, with some designs considering 20 C.
Applied Sciences (MDPI AG) 2024
Numerical Evaluation of Hot Air Recirculation in Server Rack
Make hot-aisle back pressure (hot-aisle pressure above cold aisle) a design input in contained aisles; server inlet temperature rises once back pressure reaches the fans' free-delivery point.
- A three-grid GCI study (1.22 to 1.99 million cells) selected a 1,799,871-cell trimmed hexahedral mesh with seven prism layers, near-wall y+ of about 5.
Frontiers in Energy Research (Frontiers Media SA) 2023
Performance evaluation and modeling of active tile in raised-floor data centers: An empirical study on the single rack
With active tiles, always seal under-rack gaps; if left open, low pressure at the tile surface pulls hot air in under the rack and worsens the lower servers.
- CRACs were set to 21 °C but delivered 23 °C supply, and thermal load was about 65% of cooling capacity, so one CRAC was off.