
A Quantitative Comparison of High Efficiency AC vs. DC Power Distribution for Data Centers
Schneider Electric · Neil Rasmussen, James Spitaels
Schneider Electric WP 127 compares 400/230 V AC distribution with a 380 V DC bus by multiplying UPS, wiring and IT power-supply efficiencies. The DC advantage turns out to be about one point, and smaller still at facility level.
On this page
Overview
The paper compares the two highest-efficiency distribution architectures: 400/230 V AC with no PDU transformers, and a 380 V DC bus feeding DC-input IT equipment. The method is a simple product of UPS, wiring and IT power-supply efficiencies at a 50% load baseline. Certified UPS figures at 25/50/75/100% load are: Symmetra PX double conversion 95.5/96.3/96.4/96.3%; eco-mode 97.4/98.5/98.8/98.9%; Emerson 380 V DC 93.4/95.1/94.8/94.2%; and LBNL typical legacy double conversion 87.3/88.8/88.8/88.4%.
Wiring loss uses a common design value of 1% at full load; losses vary with the square of load, giving 99.5% wiring efficiency at 50% load for both AC and DC. Delta Electronics power supplies at 20/50/80/100% load reach 85.0/93.2/93.7/93.6% on AC 208 V and 85.5/94.1/94.8/94.5% on DC 400 V, a 0.9% DC advantage at 50% load. The chains at 50% load come to DC 96.5% x 99.5% x 94.1% = 90.35%, AC 96.3% x 99.5% x 93.2% = 89.30%, and AC with the UPS in eco-mode 98.5% x 99.5% x 93.2% = 91.34%. DC is roughly a point ahead of double-conversion AC and behind eco-mode AC.
The second step asks how much of a distribution gain reaches the facility total. For a typical PUE 1.47 site (IT 68%, distribution 5%, proportional A/C losses 13%, lighting 2%, fixed A/C losses 12%), a 1% distribution efficiency gain cuts total consumption by 0.86%, and DC's 1.05% advantage yields only 0.90%. A watt saved in distribution saves about 1.13 W of facility power, because only the proportional cooling losses, about 13% of IT load, scale with it.
The authors conclude that efficiency alone does not justify moving to DC, and that widely quoted 10-30% DC savings compare against obsolete AC designs. For North America, an auto-transformer adapting 480/277 V to 400/230 V needs a transformer kVA of only 17% of system rating and costs about 1% efficiency. In the ETSI DC standard the 380 V DC system is midpoint-grounded, so the maximum voltage to ground is +/- 190 V.
Key points
- Chain efficiency at 50% load: DC 90.35%, double-conversion AC 89.30%, eco-mode AC 91.34%.
- Certified UPS efficiency at 25/50/75/100% load: Symmetra PX double conversion 95.5/96.3/96.4/96.3; eco-mode 97.4/98.5/98.8/98.9; Emerson 380 V DC 93.4/95.1/94.8/94.2; LBNL legacy 87.3/88.8/88.8/88.4.
- Wiring loss is 1% at full load and scales with load squared; 99.5% efficiency at 50% load.
- Delta PSU efficiency at 50% load: AC 208 V 93.2%, DC 400 V 94.1%; a 0.9% DC advantage.
- At PUE 1.47, a 1% distribution gain cuts total consumption by 0.86%; DC's 1.05% gives only 0.90%.
- One watt saved in distribution saves about 1.13 W at facility level (proportional cooling loss about 13% of IT load).
- An auto-transformer adapting 480/277 V to 400/230 V needs 17% of system kVA and costs about 1% efficiency.
- ETSI 380 V DC is midpoint-grounded: maximum voltage to ground +/- 190 V.
Using it in design
- Build the power-chain calculator as UPS(load) x wiring(load) x PSU(load), defaulting wiring to 1% loss at full load scaling with load squared.
- Convert distribution savings to facility savings using only the proportional cooling fraction, not by multiplying by PUE.
- Store UPS efficiency at 25/50/75/100% with its mode (double conversion or eco) and a distribution voltage option set: 480/277 AC with PDU transformer, 400/230 AC, 380 V DC midpoint-grounded.
- Flag designs claiming more than about 1-2% savings from DC versus modern 400/230 V AC, and flag North American designs with transformer PDUs as an efficiency loss.
Monthly newsletter · free
Keep your reading list current
Once a month: new library sources, changes to Turkish regulations and upcoming data centre events.
SoSo CAD
Review your power design in SoSo CAD
Inspect supply paths, equipment loads and UPS failure scenarios in one model.
Request a demo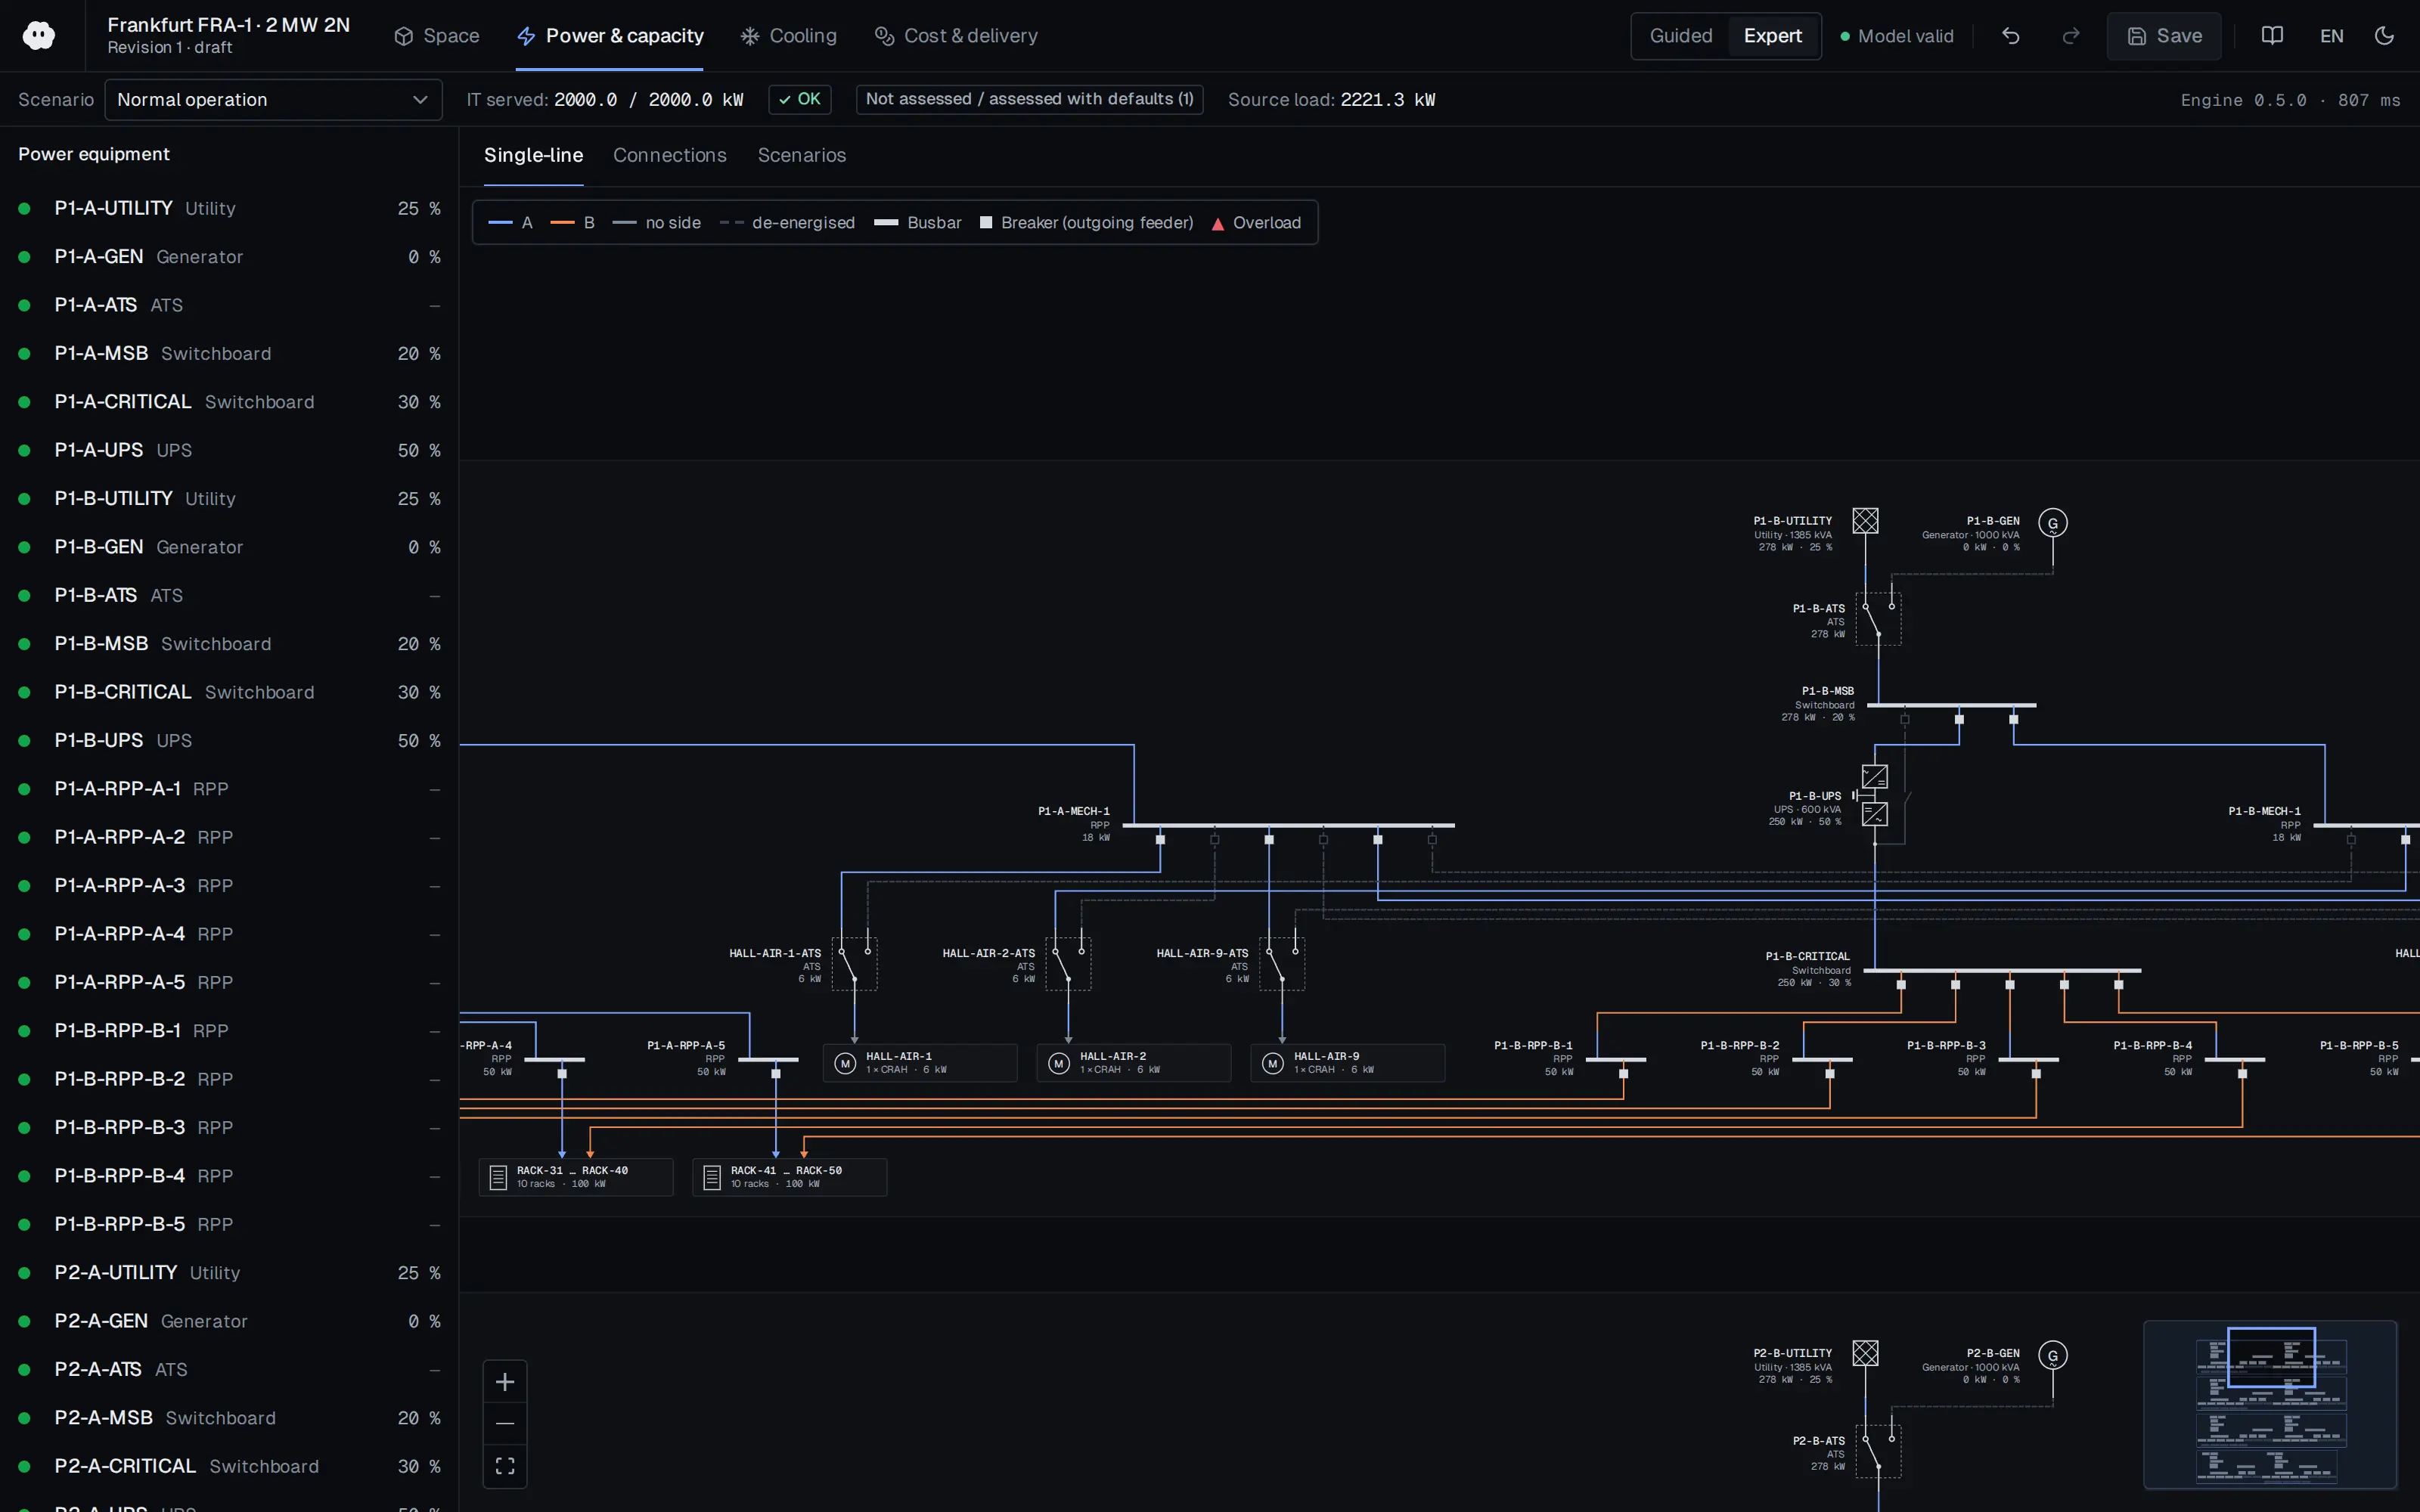
Who should read it
Electrical designers choosing between AC and DC distribution and decision makers who need to test DC savings claims.
Related standards
- ETSI EN 300 132-3-1
- IEC 62040-3
Publication details
- Authors
- Neil Rasmussen; James Spitaels
- Publisher
- Schneider Electric
- Year
- 2015
- Document number
- WP 127
- Document language
- English
- Source type
- Manufacturer
- Access
- Free to read
- Licence
- Copyright retained; citation only — the publisher’s terms apply to the original document
Citation
Neil Rasmussen; James Spitaels (2015). A Quantitative Comparison of High Efficiency AC vs. DC Power Distribution for Data Centers. Schneider Electric. WP 127. https://download.schneider-electric.com/files?p_Doc_Ref=SPD_NRAN-76TTJY_EN
Events on this subject
- Electricity Eurasia 2027
- ELECO 2026 Elektrik-Elektronik ve Biyomedikal Mühendisliği Konferansı
- The smarter E Europe (Intersolar Europe, ees Europe, Power2Drive, EM-Power)
All content and rights belong to the respective authors and publishers. SoSo CAD provides only the citation, its own summary and a link to the source, and is not responsible for the sources' content.
Related sources
All sources on this topicSchneider Electric 2016
Diesel Rotary UPS (DRUPS) vs. Static UPS: A Quantitative Comparison for Cooling and IT Applications
Store full UPS efficiency curves (10/25/50/75/100% load), ride-through, footprint and service clearance, and a technology field (static VRLA, static Li-ion, DRUPS) rather than one peak value.
- DRUPS ride-through about 8-12 seconds.
Schneider Electric 2014
Eco-mode: Benefits and Risks of Energy-saving Modes of UPS Operation
Compute eco savings through the PUE stack (UPS loss plus the cooling of that loss), not from the UPS efficiency delta alone.
- About US$10,000 a year for 1 MW at 50% load and $0.10/kWh.
Schneider Electric 2011
Calculating Total Power Requirements for Data Centers
Use it as a quick-sizing calculator in novice mode: take IT kW, future kW, floor area, cooling type and UPS input type, and output service kW/A and generator kW, with the multipliers as editable defaults.
- Actual IT power is roughly nameplate VA x 0.67.
Schneider Electric 2011
AC vs. DC Power Distribution for Data Centers
In the power-chain efficiency calculator multiply UPS, transformer/PDU, distribution and PSU efficiencies at the actual load fraction rather than nameplate, and offer architecture presets for the five options with Table 1 values as defaults.
- The paper calls the North American 480 V AC system with PDU transformers inefficient and obsolete for new designs.
IEEE Access (Institute of Electrical and Electronics Engineers (IEEE)) 2026
Review of the 800-VDC Power Delivery Architecture and Isolated 800-V to 48-V Converter Solutions for Future AI Data Centers
Define 800 VDC unipolar, ±400 VDC bipolar and 48/54 VDC busbar as separate voltage classes in the single-line diagram, each with its own conductor ampacity, breaker pole count and clearance (IEC 60664-1) checks.
- The OCP Open Rack V3 PSU specification targets above 97.5% peak efficiency and at least 96.5% across 30%-100% load.
arXiv preprint (University of Michigan) 2026
Grid Integration of AI Data Centers: A Critical Review of Energy Storage Solutions (arXiv preprint)
Layer storage by timescale (chip/server sub-ms to ms, rack ms to seconds, UPS and GiUPS sub-second to 10 s, BESS minutes to hours) and show each layer's duty in the coordination scheme.
- Rapid AI load variations often induce 5-10% voltage swings within milliseconds.