
How to Fix Hot Spots in the Data Center
Schneider Electric · Paul Lin
A Schneider Electric white paper (WP 199, 2014) that defines a hot spot strictly as an IT inlet temperature above the ASHRAE TC 9.9 recommended value and traces it to poor delivery of existing cooling rather than too little capacity.
On this page
Overview
The paper defines a hot spot strictly: a measured temperature at the IT equipment intake that exceeds the ASHRAE TC 9.9 recommended value. Hot-aisle temperature is not the test, and hot spots occur most often near the top of a rack. The author argues most arise not from insufficient cooling capacity but from poor delivery of existing cooling through leakage, bypass and recirculation. A cited Uptime Institute study found 10% of racks running hotter than guidelines, and rooms with 15 times the required cooling capacity still had hot spots in 7% to 20% of racks.
A real raised-floor case is analysed with an airflow mass and energy balance. Of 42,480 m3/h of CRAH airflow, 54% leaves through perforated tiles and 46% leaks through cutouts; only 52% reaches rack fronts, 2% is bypass and 7.15% of IT airflow (1,700 m3/h) is recirculated. Typical operator responses, namely lower set points, perforated tiles in hot aisles or near CRAHs, pedestal fans, ice, portable or extra cooling units, are classed as ineffective or emergency-only.
The recommended fixes are rack and room airflow management, containment, load relocation, supply-air temperature control and DCIM-driven fan control. Racks belong at least 3 tiles from cooling units, since high discharge velocity lowers static pressure and starves nearby tiles. In the rebalancing check, measured row airflow divided by 125 CFM/kW should roughly equal the row's rack power. Active ducted racks and active tiles support about 12 kW per rack and fan-assisted devices up to 3 kW; an appendix explains why lowering set points reduces plant capacity.
Key points
- Hot spot: IT intake temperature above the ASHRAE TC 9.9 recommended value, most often near the top of a rack.
- Case: of 42,480 m3/h CRAH air, 54% leaves via tiles and 46% leaks; only 52% reaches rack fronts.
- 7.15% of IT airflow (1,700 m3/h) is recirculated; 2% is bypass.
- Uptime Institute: 10% of racks run hot; rooms with 15x capacity still had hot spots in 7-20% of racks.
- Place racks at least 3 tiles from cooling units.
- Tile rebalancing: row airflow / 125 CFM/kW should roughly equal row rack power.
- Inspect racks above 5 kW with metered rack PDUs.
- Active ducted racks and tiles support about 12 kW per rack, fan-assist devices up to 3 kW; moving control sensors from return to supply air evens inlet temperatures.
Using it in design
- Evaluate hot spots only at rack inlets against the selected ASHRAE class recommended range, not hot-aisle temperatures.
- Warn when a rack or perforated tile on a raised floor sits within 3 tiles of a CRAH discharge.
- Compare total perforated-tile airflow per row with sum(rack kW) x 125 CFM/kW and flag over- or under-supply.
- Flag perforated tiles in hot aisles, and cooling units controlled on return air when containment is present.
Monthly newsletter · free
Keep your reading list current
Once a month: new library sources, changes to Turkish regulations and upcoming data centre events.
SoSo CAD
Check cooling capacity alongside your design
Review zone heat loads, available capacity and the capacity balance after the largest unit is lost in SoSo CAD.
Request a demo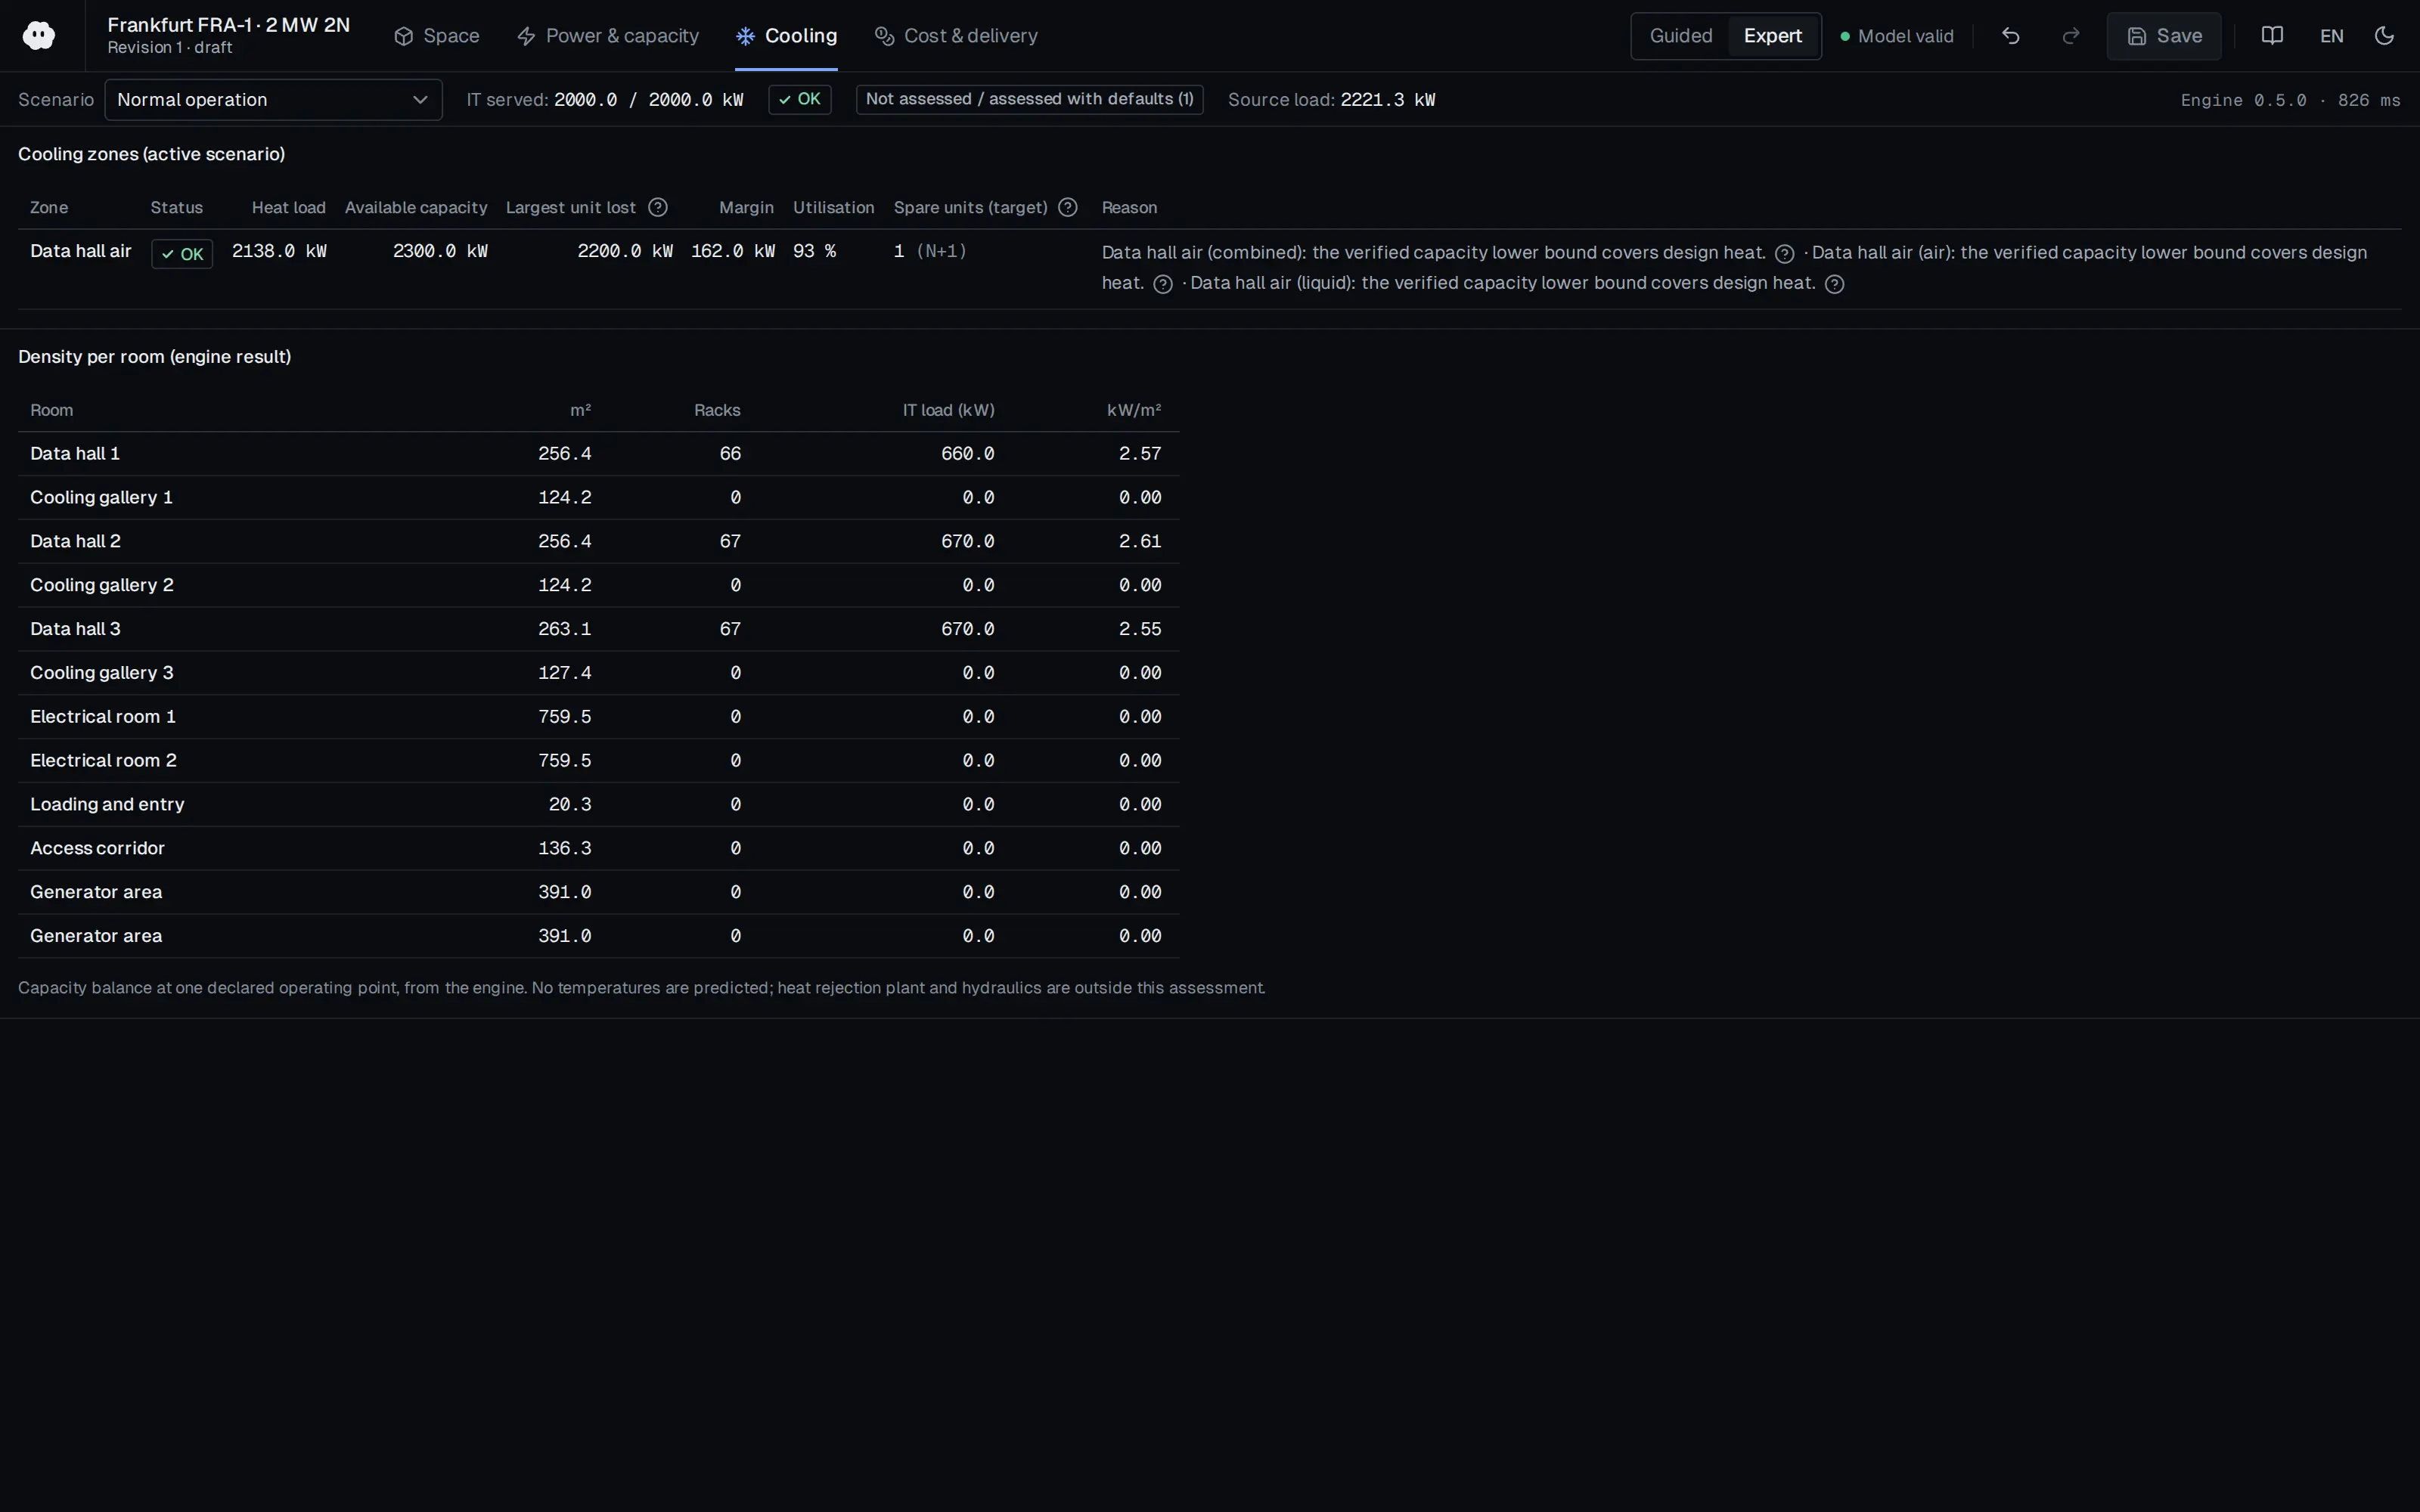
Who should read it
Operations and design engineers resolving cooling airflow problems.
Related standards
- ASHRAE TC 9.9 Thermal Guidelines for Data Processing Environments
- EN 50600-2-3
Publication details
- Authors
- Paul Lin
- Publisher
- Schneider Electric
- Year
- 2014
- Document number
- WP 199
- Document language
- English
- Source type
- Manufacturer
- Access
- Free to read
- Licence
- Copyright retained; citation only — the publisher’s terms apply to the original document
Citation
Paul Lin (2014). How to Fix Hot Spots in the Data Center. Schneider Electric. WP 199. https://download.schneider-electric.com/files?p_Doc_Ref=SPD_VAVR-9GNNGR_EN
Events on this subject
Browse the events calendarAll content and rights belong to the respective authors and publishers. SoSo CAD provides only the citation, its own summary and a link to the source, and is not responsible for the sources' content.
Related sources
All sources on this topicSchneider Electric 2014
Cooling Audit for Identifying Potential Cooling Problems in Data Centers
Use these coefficients as the default room heat-load method and compare the result against the lower of CRAC sensible capacity and heat-rejection capacity.
- CRAC set points are 20-25 C and 40-55% RH; filters are changed quarterly.
Schneider Electric 2010
Impact of High Density Hot Aisles on IT Personnel Work Conditions
Add a hot-aisle work-environment check
- Air behind racks averaged about 4.4 C (8 F) above the cold aisle in the uncontained case
Journal of Engineering Research and Sciences (Journal of Engineering Research and Sciences) 2026
CFD Analysis of Data Center Hall Cooling Performance under Normal and Failure Modes with Control Strategies and Airflow Leakages
Do thermal verification of failure mode (two ACUs offline) with realistic air leakage (cabinet gaps, HAC panel joints); a leak-free model can comply while the leaky model exceeds 32 °C.
- The grid study selected 7,288,454 cells with the standard k-epsilon model and wall functions.
Applied System Innovation (MDPI AG) 2026
Proactive Cooling Control Algorithm for Data Centers Based on LSTM-Driven Predictive Thermal Analysis
For predictive cooling control, plan at least one inlet and one outlet temperature sensor per rack; below that, prediction error rose by about 22%.
- The LSTM uses a 60 min input window and a 30 min prediction horizon, with a reported RMSE of 0.25 and R² of 0.985.
arXiv preprint (Nanyang Technological University / NVIDIA AI Technology Center) 2025
Transforming Future Data Center Operations and Management via Physical AI
For fast what-if analysis consider a CFD-trained surrogate (inference about 0.01 s), but state that the surrogate is only as accurate as the CFD it was trained on and is not validated against measurements.
- The CapEx of building a data centre with 100k B200 GPUs is 4.5 to 5 billion US dollars and annual electricity OpEx can reach 400 million.
Energies (MDPI AG) 2023
Artificial Intelligence-Based Temperature Twinning and Pre-Control for Data Center Airflow Organization
For an operational thermal twin, define adequate sensor density covering supply, return, cold-aisle and hot-aisle temperatures and equipment power (728 points at 15-minute sampling in this study).
- The DQN controller cut PUE by an average of 2.6% and WUE by 2.5% over a year.