
Continuous Metering and Monitoring of PUE in Data Centers
Schneider Electric · Wendy Torell
A Schneider Electric white paper (WP 204, 2016) on planning a permanent PUE metering scheme instead of relying on models or one-off audits.
On this page
Overview
The paper explains how to plan permanent PUE metering rather than rely on models or one-off audits, which miss weather and load variation. The steps are choosing a Green Grid reporting level, tracing circuits so every IT and non-IT load is identified, deciding where embedded meters suffice and where new ones are needed, installing meters in a live facility, and aggregating data in a DCIM/EPMS. Levels differ by IT-load meter location: Level 1 at UPS output, Level 2 at PDU output, Level 3 at IT equipment input, for example metered rack PDUs.
Data frequency depends on the level: Level 1 requires monthly measurement while Level 3 requires 15 minutes or less, and 15 minutes is the recommended minimum frequency. Non-IT loads such as air handlers on the UPS output inflate the measured IT load at Level 1 and artificially improve PUE. IT-load metering cost ranges from free with embedded meters to $300 per kW of IT load. Generators are suggested for estimation rather than metering because they are often shared and are not a big PUE driver.
Shared-building cases get detailed treatment. In the panel examples a mostly-data-center panel needs 3 meters (input minus two office breakers) while a mostly-office panel needs 4 (the sum of four CRAH breakers). A shared chiller is apportioned with supply/return temperature sensors and a flow meter on both the main and data center loops, multiplying chiller electrical power by the ratio of data center to chiller heat rejection. Split-core current sensors are less accurate than solid-core but suit live installs; ultrasonic flow meters avoid draining piping but cost far more. The dashboard should show PUE, percent IT load and a subsystem energy breakdown so poor PUE from light loading is not mistaken for poor design.
Key points
- Level 1 meters IT at UPS output, Level 2 at PDU output, Level 3 at IT equipment input.
- Level 1 needs monthly data, Level 3 every 15 minutes or less; 15 minutes is the recommended minimum frequency.
- Non-IT loads on UPS output inflate IT load at Level 1 and flatter PUE.
- IT-load metering costs from free to $300 per kW of IT load.
- Panel example: 3 meters for a mostly-data-center panel, 4 for a mostly-office panel.
- Shared chiller: sensors and flow meters on both loops; chiller power times heat-rejection ratio.
- Estimate generators rather than metering them.
- Split-core CTs are less accurate but suit live installs; ultrasonic flow meters are much more expensive.
Using it in design
- In the single-line editor let users place meter nodes tagged by role (utility input, UPS output, PDU output, rack input, mechanical) and derive the achievable Green Grid level automatically.
- Warn when non-IT loads are fed from UPS output while PUE is metered at Level 1; detect double counting when a metered panel feeds another metered panel.
- Flag shared chillers or generators with no apportioning method (ratio, subtract, thermal metering, model).
- Default to 15-minute logging; the dashboard spec includes PUE, % IT load and subsystem breakdown.
Monthly newsletter · free
Keep your reading list current
Once a month: new library sources, changes to Turkish regulations and upcoming data centre events.
SoSo CAD
Compare the cost of design decisions
Evaluate equipment costs, energy expenses and total cost of ownership (TCO) using your inputs and assumptions in SoSo CAD.
Request a demo
Who should read it
Design and operations engineers planning PUE monitoring and meter layouts.
Related standards
- ISO/IEC 30134-2
- EN 50600-4-2
- ASHRAE Datacom Series Book 11
Publication details
- Authors
- Wendy Torell
- Publisher
- Schneider Electric
- Year
- 2016
- Document number
- WP 204
- Document language
- English
- Source type
- Manufacturer
- Access
- Free to read
- Licence
- Copyright retained; citation only — the publisher’s terms apply to the original document
Citation
Wendy Torell (2016). Continuous Metering and Monitoring of PUE in Data Centers. Schneider Electric. WP 204. https://download.schneider-electric.com/files?p_Doc_Ref=SPD_WTOL-936RKM_EN
Events on this subject
Browse the events calendarAll content and rights belong to the respective authors and publishers. SoSo CAD provides only the citation, its own summary and a link to the source, and is not responsible for the sources' content.
Related sources
All sources on this topicSchneider Electric 2023
3 Steps to Calculate Total Enterprise IT Energy Consumption Using DCIM
Model each meter point as a power-tree node with an aggregate flag so roll-ups never sum a parent and its child.
- Unmetered devices: 60% of manufacturer rating x assumed hours of use.
Schneider Electric 2011
Implementing Energy Efficient Data Centers
Expose a 'value of a kW' widget: lifetime cost = 8.76 MWh/yr x tariff x PUE x life (default $0.12/kWh, 10 years) plus a capacity-cost term.
- Efficient server form factors cut IT power about 20%.
Schneider Electric 2011
Electrical Efficiency Measurement for Data Centers
Never output a single PUE: produce a PUE-vs-IT-load curve (10-100%) and an annual PUE from hourly weather bins, labelling the averaging period explicitly.
- Using UPS output as IT load introduces a 2-25% error, which the model can subtract.
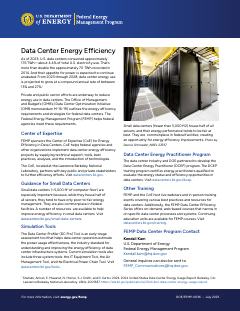
U.S. DOE FEMP 2025
Data Center Energy Efficiency (Fact Sheet DOE/FEMP-0036, July 2025)
For a small data center or server room, write metering, air management and monitoring requirements into the specification from the start, given that energy management in this class tends to be poor.
- Data center energy use is projected to grow 13% to 27% per year (CAGR) from 2023 through 2028.
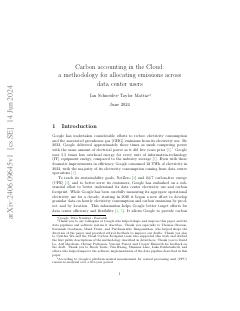
arXiv preprint (cs.SE), Google 2024
Carbon accounting in the Cloud: a methodology for allocating emissions across data center users
In allocating carbon to data-centre users, give idle power to whoever holds the resource allocation and share dynamic power by actual usage; because an idle server draws about 45% of peak power, the idle share is large.
- Resources with equivalent busy power used to weight idle-power allocation: 1 Intel Skylake N1 CPU core = 20 GiB RAM = 1 TiB SSD = 6 TiB HDD.
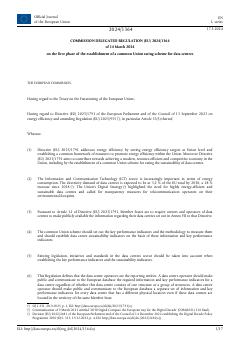
European Commission (Official Journal of the European Union) 2024
Commission Delegated Regulation (EU) 2024/1364 of 14 March 2024 on the first phase of the establishment of a common Union rating scheme for data centres
Build the metering architecture to the regulation: meters on every supply input for total energy (grid and back-up generator separately) and at every UPS output for IT energy, with a system that retains measurement point and device records for at least 10 years.
- Data centre electricity demand is projected to reach 3.2% of total EU demand by 2030, a 28% increase over 2018.