
Totally Integrated Power - Application Models for Power Distribution: Data Centres
Siemens · Siegbert Hopf
This 80-page Siemens planning manual from 2013 walks the whole electrical chain of a data centre, from medium voltage to sub-distribution. Its Tier IV worked example is especially useful because it puts numbers on how redundancy choices inflate installed UPS capacity and floor area.
On this page
Overview
The manual moves in sequence through planning tasks, availability concepts, MV switchgear, cast-resin transformers, standby generator sets, UPS, LV switchboards, sub-distribution and power management. Availability is defined as A = MTBF / (MTBF + MTTR) and the BSI availability classes are reproduced, which ties the redundancy decision to a measurable quantity instead of intuition. The space-planning section gives tier-dependent infrastructure space factors: Tier II versus Tier I ranges from x1.2 (n=5) to x2 (n=1), Tier III is 1.25 times Tier II, Tier IV (n+n) is 2 times Tier I, and Tier IV (n+1)+(n+1) is 2.4-4 times Tier I.
For the same IT load, the grey space therefore grows sharply as redundancy rises. In the worked example, a 2,400 kW ICT load at PUE 1.5 gives 3,600 kW total, four computer rooms of 300 m2 and roughly 2,400 m2 of total area. The (N+1)+(N+1) design installs 7,200 kVA of UPS apparent-power capacity for that load; the source notes that kVA and kW are different units, so the figure alone is not a real-power multiplier.
Swing concepts are shown to recover utilisation. It is a 2013 vendor manual: product and topology examples reflect Siemens' system approach and do not track every detail of the current Uptime Tier Standard. It still provides a calculation skeleton aligned with IEC 60364, IEC 61439, IEC 62040-3 and EN 50600, which makes it a good starting reference for early-stage sizing.
Key points
- Availability A = MTBF / (MTBF + MTTR).
- Space factors: Tier II vs I x1.2 (n=5) to x2 (n=1); Tier III vs II x1.25; Tier IV (n+n) vs I x2; Tier IV (n+1)+(n+1) vs I x2.4-4.
- Example: 2,400 kW ICT x PUE 1.5 = 3,600 kW total; 4 computer rooms x 300 m2; about 2,400 m2 total.
- The (N+1)+(N+1) example installs 7,200 kVA of UPS apparent power for 2,400 kW ICT; kVA and kW differ, so this is not a real-power multiplier.
- Critical (ICT) to infrastructure power split is about 2:1 (PUE about 1.5).
- Safety-services changeover is typically within 15 s (0.15 s for some circuits).
- Cast-resin transformers go up to 2,500 kVA; forced ventilation can lift a 1,000 kVA unit to about 1,300-1,500 kVA.
Using it in design
- Use the tier factors as defaults in the early-stage area estimator: grey space = white space x factor.
- Show installed UPS / IT load per topology as a cost KPI (N=1.0, 2N=2.0, 2(N+1)=about 3.0).
- Build the availability calculator on A=MTBF/(MTBF+MTTR) with series and parallel composition.
- Keep kVA and kW separate: report redundancy multipliers on real power and UPS capacity on apparent power.
Monthly newsletter · free
Keep your reading list current
Once a month: new library sources, changes to Turkish regulations and upcoming data centre events.
SoSo CAD
Review your power design in SoSo CAD
Inspect supply paths, equipment loads and UPS failure scenarios in one model.
Request a demo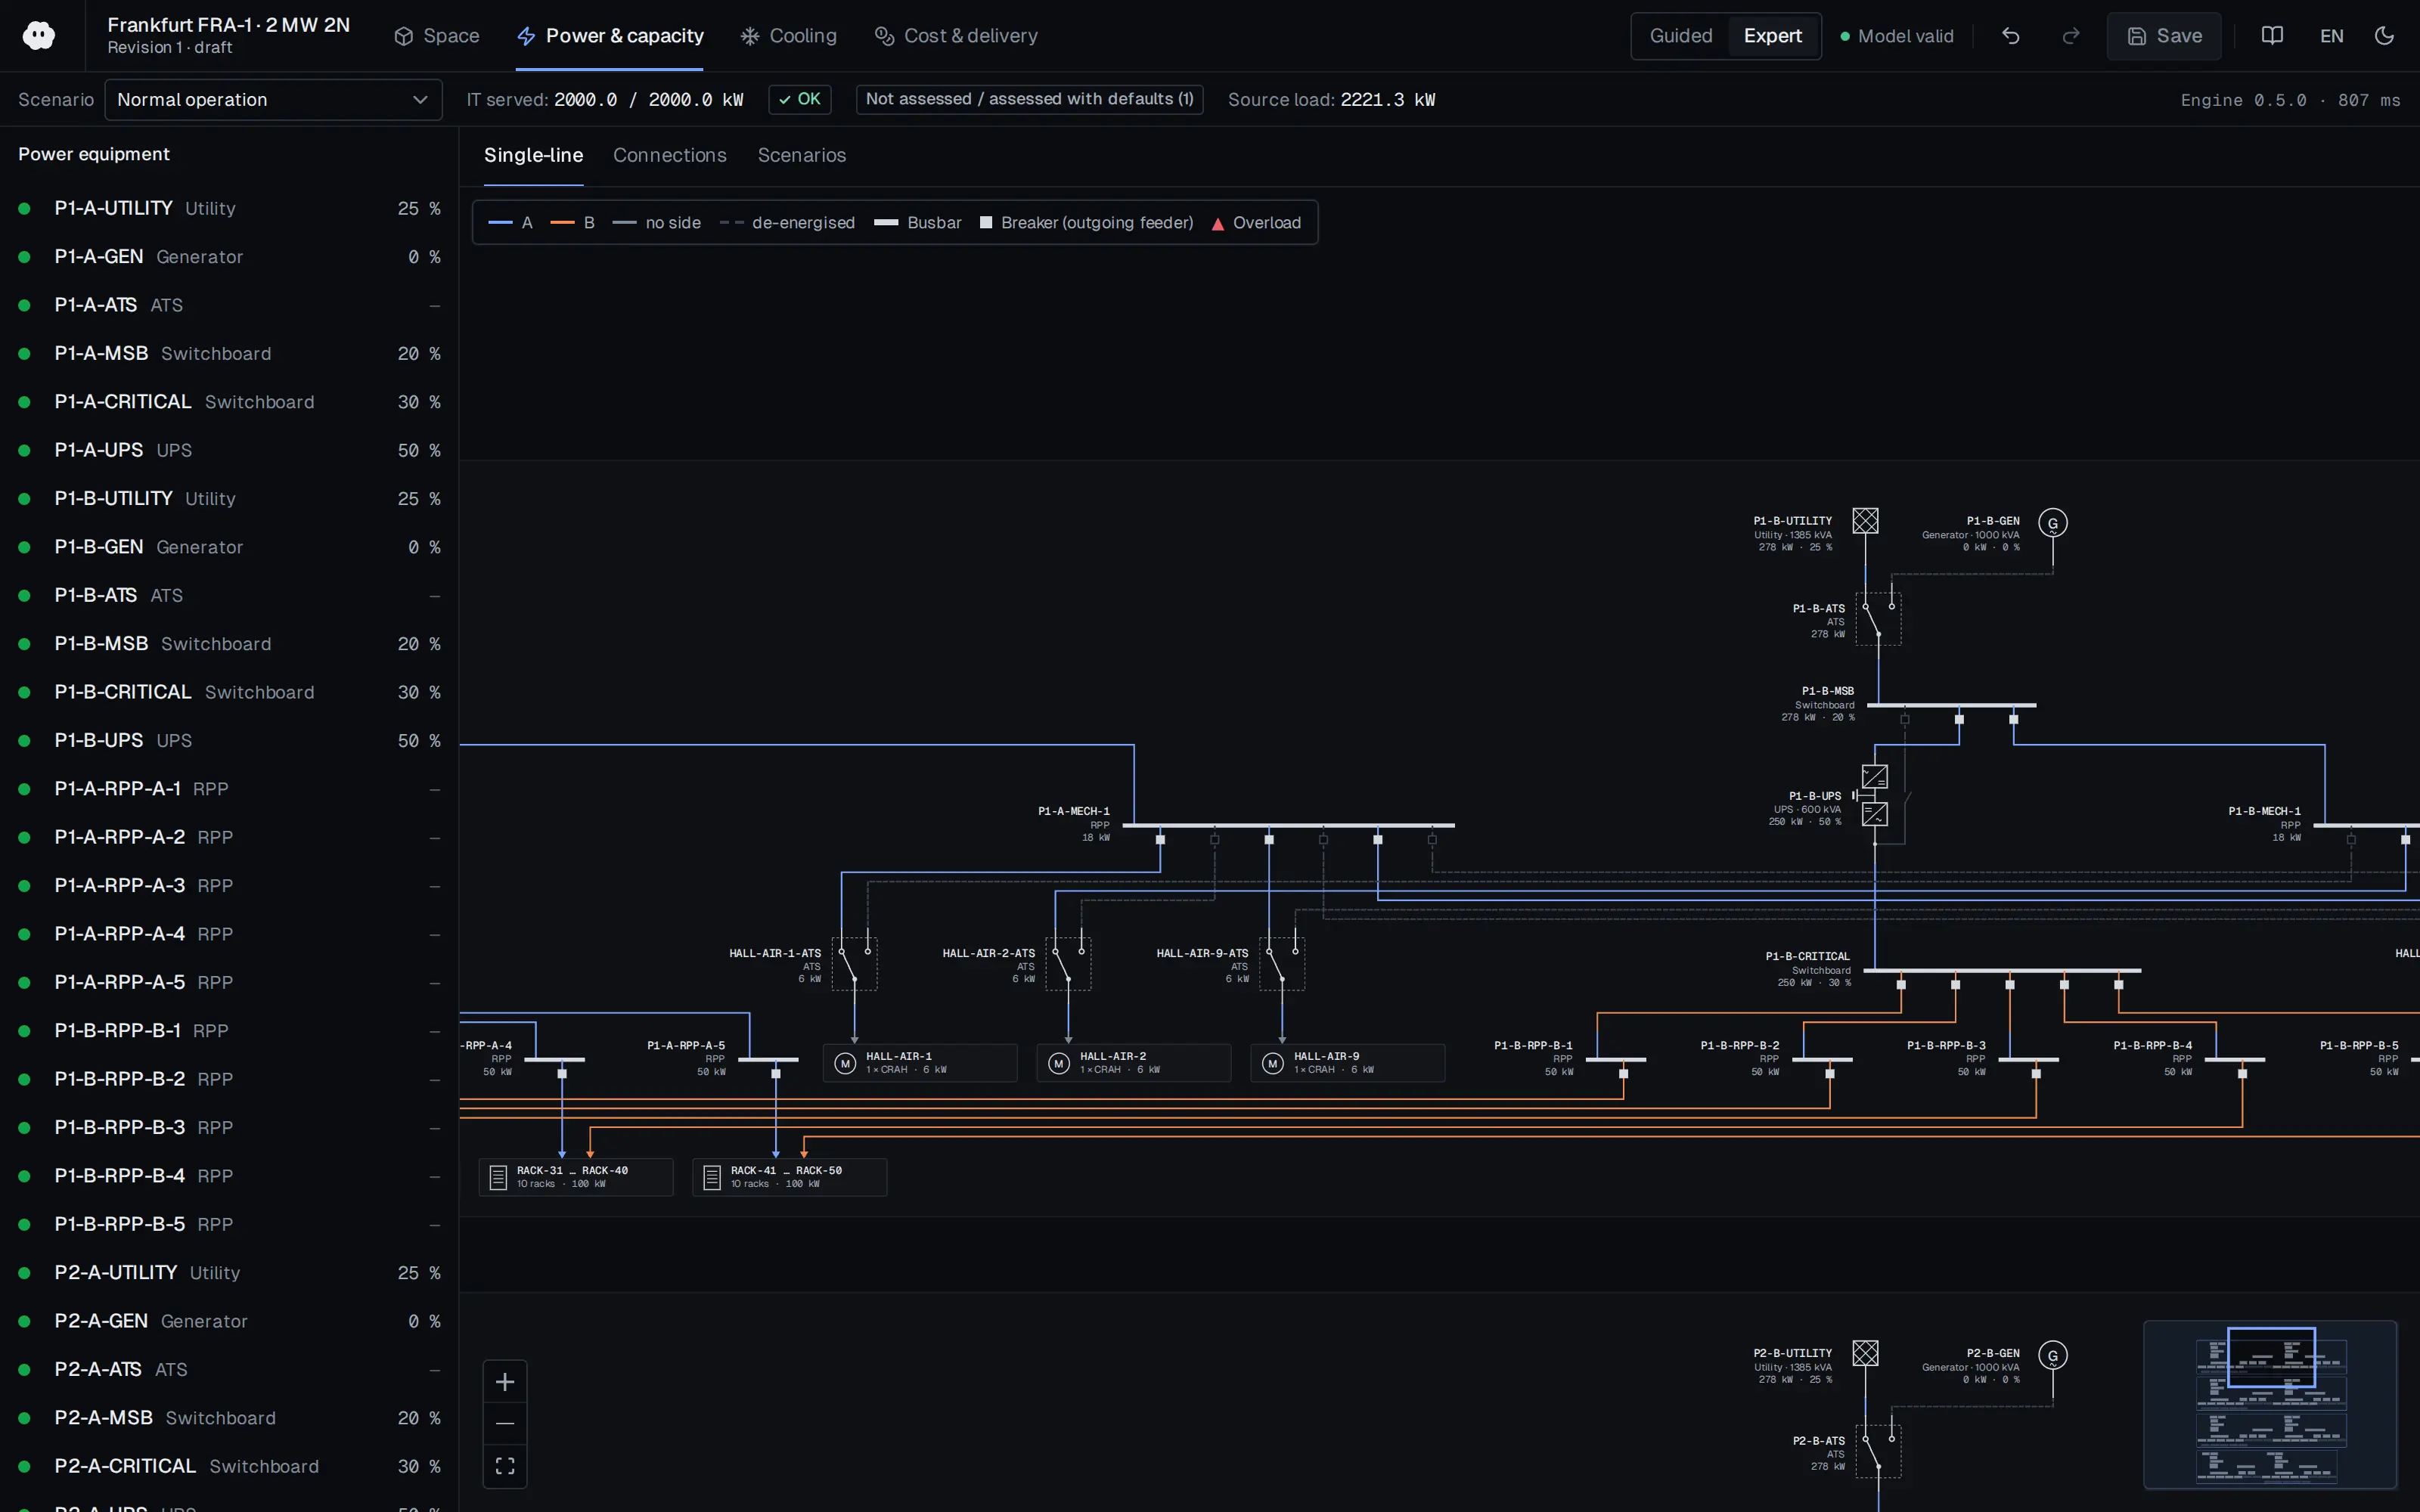
Who should read it
Design engineers who need to estimate redundancy and floor area for a data centre electrical chain early.
Related standards
- IEC 60364
- IEC 61439
- IEC 62040-3
- EN 50600
- Uptime Tier Standard: Topology
- BSI High-Availability Compendium
Publication details
- Authors
- Siegbert Hopf
- Publisher
- Siemens
- Year
- 2013
- Document language
- English
- Source type
- Manufacturer
- Access
- Free to read
- Licence
- Copyright retained; citation only — the publisher’s terms apply to the original document
Citation
Siegbert Hopf (2013). Totally Integrated Power - Application Models for Power Distribution: Data Centres. Siemens. https://assets.new.siemens.com/siemens/assets/api/uuid:7c0c711e32fb88aab5569489cb754c148a1f2d50/power-distribution-in-data-centres.pdf
Events on this subject
Browse the events calendarAll content and rights belong to the respective authors and publishers. SoSo CAD provides only the citation, its own summary and a link to the source, and is not responsible for the sources' content.
Related sources
All sources on this topicSiemens 2018
Totally Integrated Power - Planning of Electric Power Distribution: Technical Principles
Offer W/m2 defaults by building type (data centre vs IT room) and redundancy-dependent simultaneity factors in early sizing.
- Harvard Research Group defines AEC-0 to AEC-5; AEC-4 is fault-tolerant 24/7.
FEMA 2014
FEMA P-1019, Emergency Power Systems for Critical Facilities: A Best Practices Approach to Improving Reliability (September 2014)
At critical-facility data centers, place generators, ATS, fuel tanks and pumps above the greatest of BFE + 3 ft, DFE + 1 ft and 500-year elevation + 1 ft, and prefer elevation to dry floodproofing.
- Generators over 300 kW are almost exclusively diesel-fueled.
ABB 2026
Next-Generation Medium-Voltage Architecture for AI Data Centers
For loads above roughly 30-50 MW add a grid-code compliance checklist (LVRT duration, frequency band, RoCoF, PF) and let users choose LV-UPS versus MV-UPS architecture.
- BESS blocks 0.6-21.6 MW with 1, 2 or 4 h durations
Eaton 2025
Data Center as a Good Grid Citizen
Add grid-code parameters to the utility connection object: UFLS stages, LVRT curve, post-fault power recovery ramp (%/s) and short-circuit ratio at the PCC.
- Typical BESS Li-ion cells are limited to about 1C discharge.
arXiv preprint (University of Michigan) 2026
Grid Integration of AI Data Centers: A Critical Review of Energy Storage Solutions (arXiv preprint)
Layer storage by timescale (chip/server sub-ms to ms, rack ms to seconds, UPS and GiUPS sub-second to 10 s, BESS minutes to hours) and show each layer's duty in the coordination scheme.
- Rapid AI load variations often induce 5-10% voltage swings within milliseconds.

Open Compute Project Foundation 2026
Interface Specification Between Hyperscalers and Utility Grid for Disturbance Performance (Version 1.0.0)
For a new site, write the POI LVRT/HVRT envelope and the PFAPR requirement (90% within 2 s) as design criteria, and settle which voltage measurement (line-to-neutral or line-to-line) governs during protection coordination with the utility.
- In ERCOT NOGRR 282, cooling load is subtracted from the pre-fault load used to judge PFAPR.