
Totally Integrated Power Technical Series Edition 15: DC and AC Power Supply Systems in Data Centres
Siemens
This 2015 Siemens technical paper asks whether DC distribution in the white space really delivers large savings. It argues that the widely quoted 28% DC advantage rests on an outdated AC baseline and that modern chains differ by only a few percentage points.
On this page
Overview
The paper starts by looking at where a data centre's energy goes. Critical (ICT) consumption versus non-critical infrastructure consumption is put at about 2:1, so savings potential sits in cooling and auxiliaries as much as in the power chain. That framing shows how small a share of total consumption the DC-versus-AC chain efficiency difference represents. The core critique targets the often-cited 28.2% DC saving from LBNL.
Siemens shows the result depends on an outdated AC reference chain; other comparisons using modern high-efficiency UPS and server power supplies put the difference at roughly 5-7%. The message is that the headline figure is entirely a function of which baseline chain was modelled. The efficiency section notes that modern UPS reach 95% or better, yet UPS load utilisation in redundant systems typically sits near 40%.
Read together, the two facts mean that part-load operating point, not peak efficiency, drives the result, and any DC/AC comparison has to be made at that point. It is a manufacturer publication taking a sceptical stance on DC; it mentions DC standards such as ETSI EN 300 132-3 (380 VDC) but gives no independent field measurements. It remains a short, concrete example of how to interrogate the single number that dominates the DC debate.
Key points
- Critical (ICT) to non-critical consumption ratio is about 2:1.
- The widely quoted 28.2% DC saving (LBNL) rests on an outdated AC baseline; other comparisons give about 5-7%.
- Modern UPS reach 95%+ efficiency.
- UPS load utilisation in redundant systems is typically about 40%.
- Related standards: IEC 60364, ETSI EN 300 132-3 (380 VDC), IEC 62040-3.
Using it in design
- When comparing AC and DC distribution, compute chain efficiency from component curves at realistic part load instead of quoting headline savings.
- Flag the 28% figure as outdated and in conflict with newer sources.
- Model the UPS at about 40% load in redundant topologies and use the efficiency at that point, not the peak.
- Show the DC advantage as a 5-7% range together with the assumed chain components in the comparison output.
Monthly newsletter · free
Keep your reading list current
Once a month: new library sources, changes to Turkish regulations and upcoming data centre events.
SoSo CAD
Review your power design in SoSo CAD
Inspect supply paths, equipment loads and UPS failure scenarios in one model.
Request a demo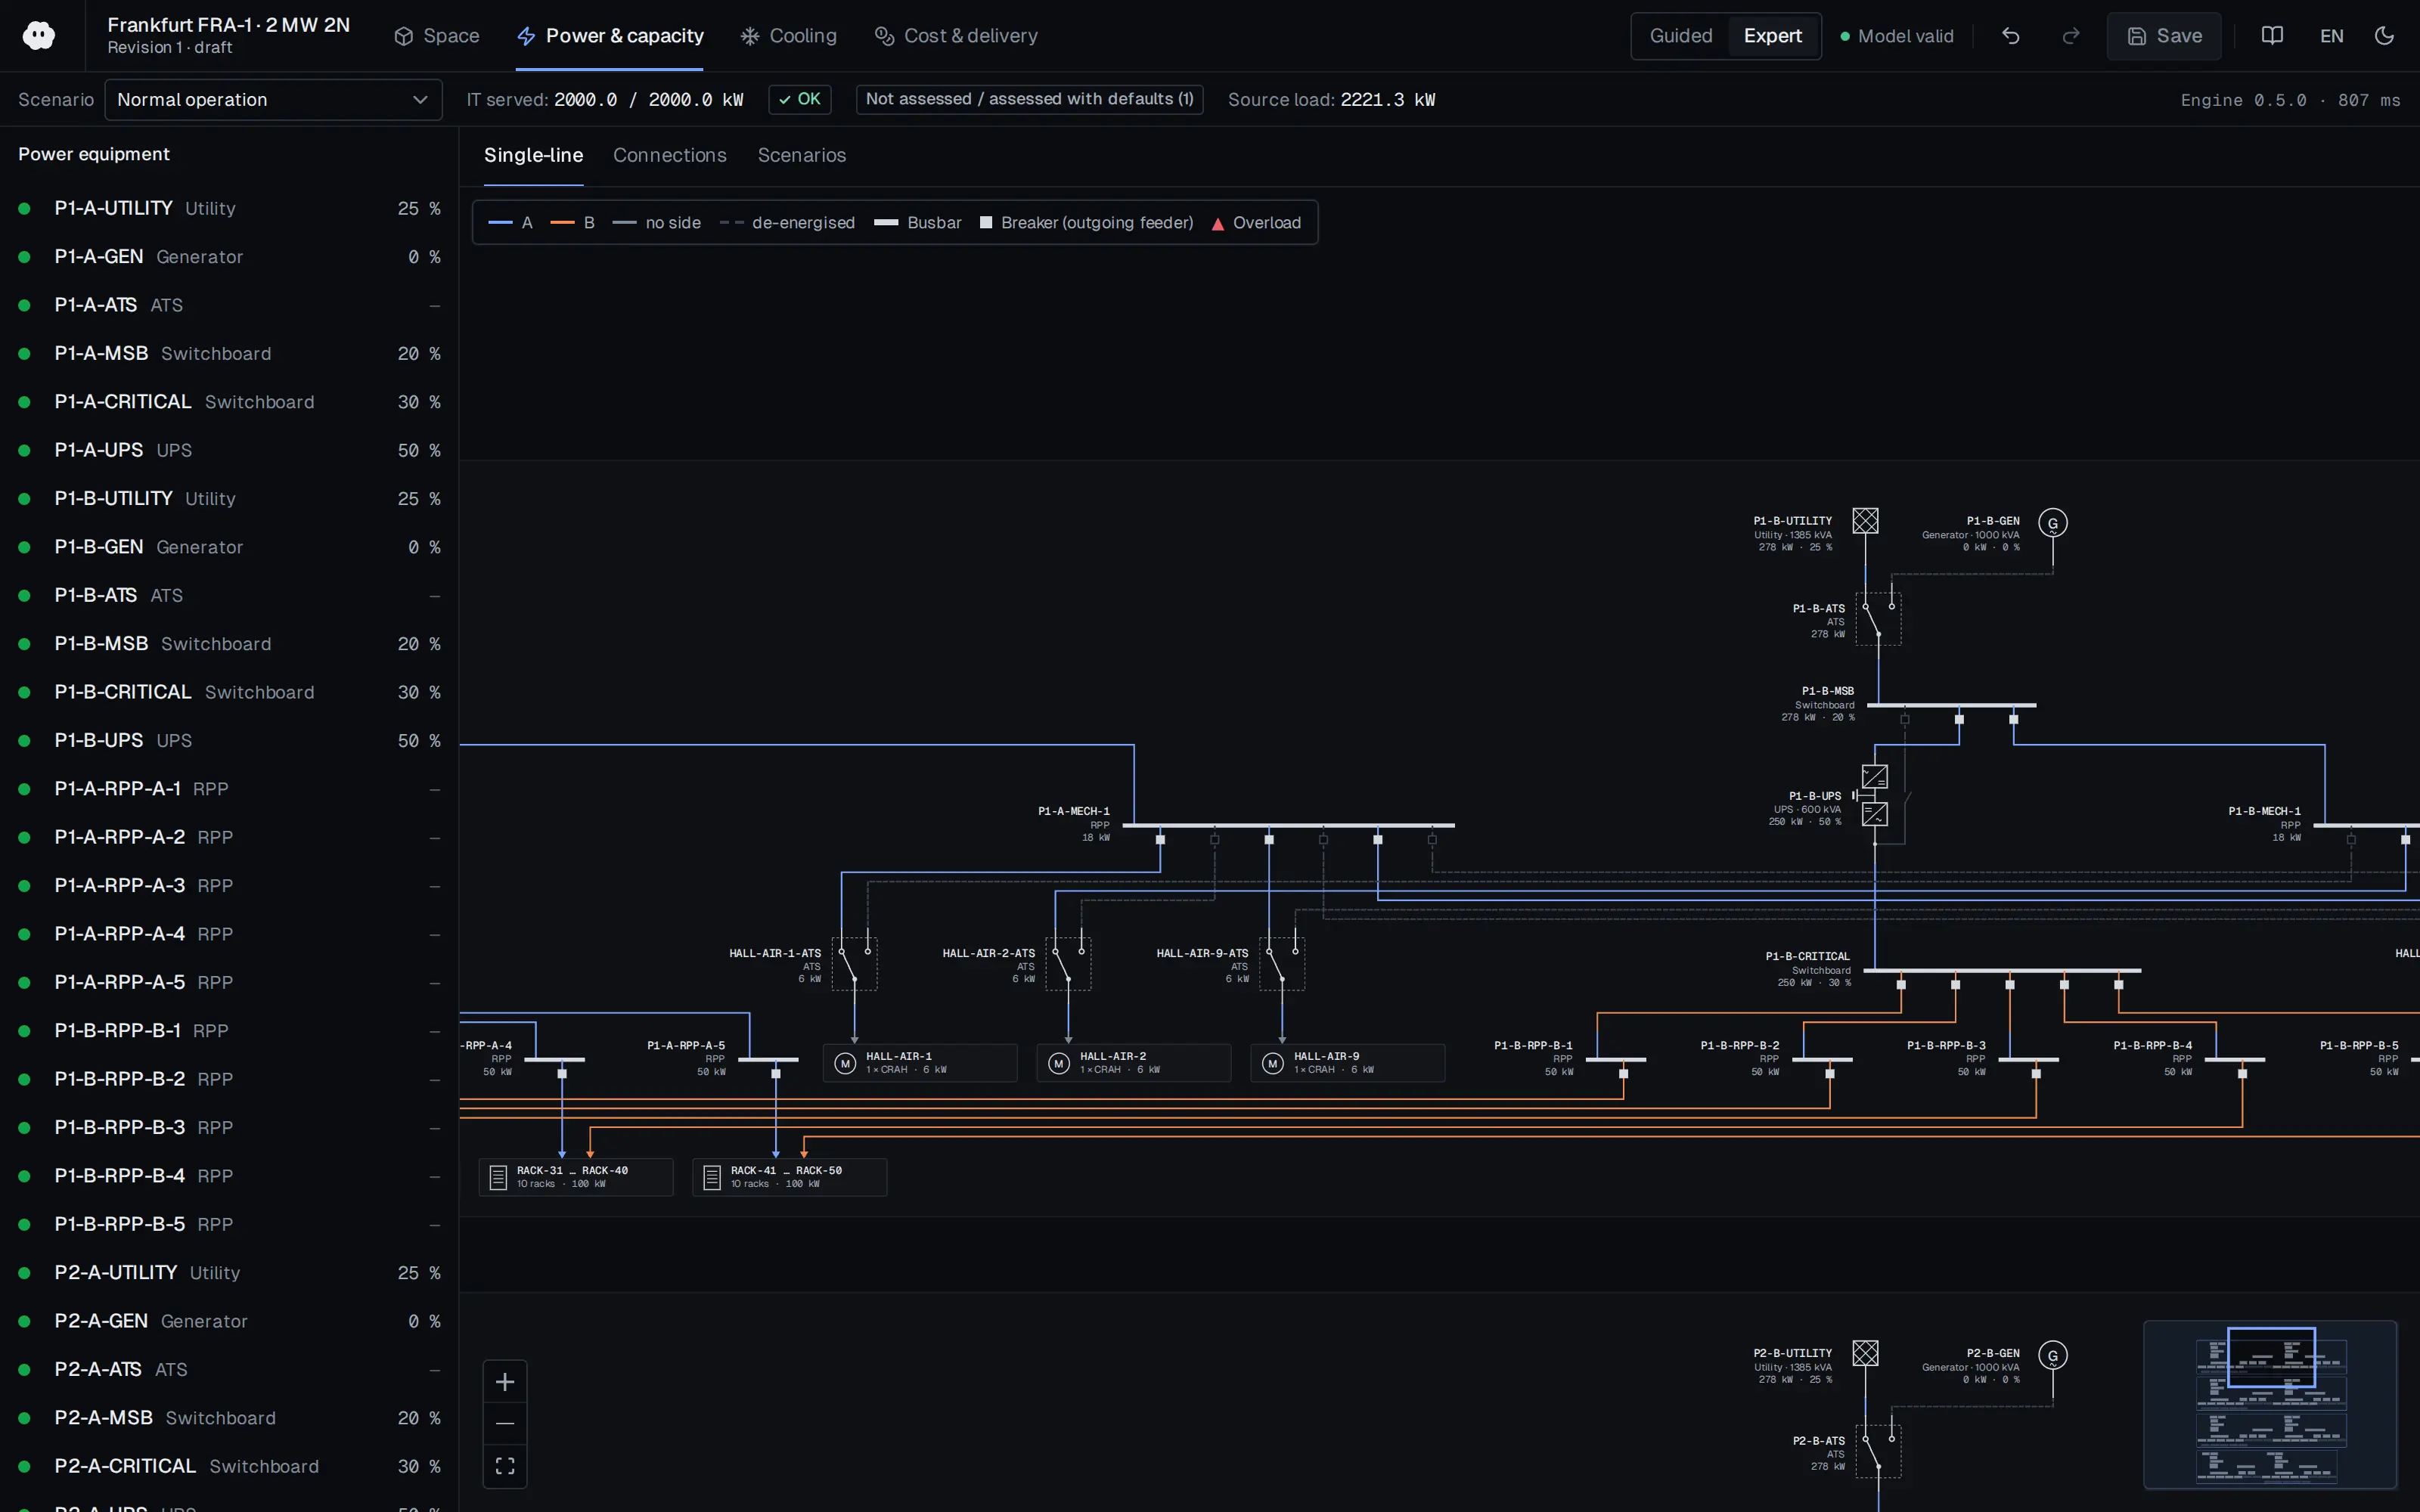
Who should read it
Designers and decision makers who need to test efficiency claims in the AC-versus-DC distribution debate.
Related standards
- IEC 60364
- ETSI EN 300 132-3 (380 VDC)
- IEC 62040-3
Publication details
- Authors
- Siemens
- Publisher
- Siemens
- Year
- 2015
- Document number
- Technical Series Ed. 15
- Document language
- English
- Source type
- Manufacturer
- Access
- Free to read
- Licence
- Copyright retained; citation only — the publisher’s terms apply to the original document
Citation
Siemens (2015). Totally Integrated Power Technical Series Edition 15: DC and AC Power Supply Systems in Data Centres. Siemens. Technical Series Ed. 15. https://assets.new.siemens.com/siemens/assets/api/uuid:4cff3919385379ba4157a27019b27e2dad86d493/15-direct-and-alternating-power-supply-in-a-data-center.pdf
Events on this subject
- Electricity Eurasia 2027
- ELECO 2026 Elektrik-Elektronik ve Biyomedikal Mühendisliği Konferansı
- The smarter E Europe (Intersolar Europe, ees Europe, Power2Drive, EM-Power)
All content and rights belong to the respective authors and publishers. SoSo CAD provides only the citation, its own summary and a link to the source, and is not responsible for the sources' content.
Related sources
All sources on this topicSiemens 2018
Totally Integrated Power - Planning of Electric Power Distribution: Technical Principles
Offer W/m2 defaults by building type (data centre vs IT room) and redundancy-dependent simultaneity factors in early sizing.
- Harvard Research Group defines AEC-0 to AEC-5; AEC-4 is fault-tolerant 24/7.
Siemens 2013
Totally Integrated Power - Application Models for Power Distribution: Data Centres
Use the tier factors as defaults in the early-stage area estimator: grey space = white space x factor.
- Critical (ICT) to infrastructure power split is about 2:1 (PUE about 1.5).
IEEE Access (Institute of Electrical and Electronics Engineers (IEEE)) 2026
Review of the 800-VDC Power Delivery Architecture and Isolated 800-V to 48-V Converter Solutions for Future AI Data Centers
Define 800 VDC unipolar, ±400 VDC bipolar and 48/54 VDC busbar as separate voltage classes in the single-line diagram, each with its own conductor ampacity, breaker pole count and clearance (IEC 60664-1) checks.
- The OCP Open Rack V3 PSU specification targets above 97.5% peak efficiency and at least 96.5% across 30%-100% load.
arXiv preprint (University of Michigan) 2026
Grid Integration of AI Data Centers: A Critical Review of Energy Storage Solutions (arXiv preprint)
Layer storage by timescale (chip/server sub-ms to ms, rack ms to seconds, UPS and GiUPS sub-second to 10 s, BESS minutes to hours) and show each layer's duty in the coordination scheme.
- Rapid AI load variations often induce 5-10% voltage swings within milliseconds.
Advances in Applied Energy (Elsevier BV) 2026
Grid Integration of AI Data Centers: A Critical Review of Energy Storage Solutions
Layer storage by timescale: GPU/server supercapacitors for sub-second swings, rack BBUs for minutes, facility GiUPS and BESS for grid services and longer durations; show each layer's duty and coordination separately in the architecture.
- BESS cost fell from about $7,500/kWh in 1991 to $133/kWh in 2024, with about $80/kWh projected by 2030.
IEEE Access (Institute of Electrical and Electronics Engineers (IEEE)) 2025
Fast Frequency Response Potential of Data Centers Through Workload Modulation and UPS Coordination
For a UPS that will provide grid services, define the SOC window (for example 20-80%) and show by calculation that backup autonomy is preserved inside it.
- The coordinated strategy cut nadir deviation by 57% and recovery time by 34%, with task delay below 2%.