
The carbon and water footprints of data centers and what this could mean for artificial intelligence
Patterns (Elsevier BV) · Alex de Vries-Gao
Patterns journal paper estimating the carbon and water footprint of AI workloads using proxies from operator reports and grid factors.
On this page
Overview
This 2025 paper in Patterns estimates the carbon and water footprint of AI workloads. Because operators do not separate AI from other workloads, the study uses proxies from operator environmental reports, grid carbon intensity and grid water intensity. It first checks how much big tech firms disclose about electricity, PUE, WUE, and direct and indirect water, then applies location-specific grid factors to reported data-centre electricity use, and finally scales these to AI power demand.
Applying grid factors to an estimated AI power demand of 9.4 GW at the end of 2024, rising to 23 GW through 2025, gives AI carbon emissions of 32.6-79.7 million t CO2 in 2025. On the same basis, the water footprint of AI systems alone could reach 312.5-764.6 billion L in 2025, assuming water-intensity factors stay constant. The paper cites the IEA estimate of 560 billion L total data-centre water consumption in 2023: 373 billion L indirect, 140 billion L direct and about 47 billion L hardware manufacturing.
Grid water intensity varies widely between sites: for Apple US sites it ranges from 2.84 L/kWh (Mesa, AZ) to 11.98 L/kWh (Maiden, NC), compared with 1.74 L/kWh for Meta's Iowa and Illinois sites. No company reports AI-specific metrics, and reporting of PUE, WUE and indirect water is inconsistent between operators; reported average WUE values include 0.15, 0.19, 0.30 and 1.61 m3/MWh. The paper concludes that the IEA may underestimate data-centre water use. Because results rest on proxies, they are estimates, not measurements.
Key points
- Applying grid factors to estimated AI power demand of 9.4 GW at the end of 2024, rising to 23 GW through 2025, gives AI carbon emissions of 32.6-79.7 million t CO2 in 2025.
- On the same basis, AI systems' water footprint alone could reach 312.5-764.6 billion L in 2025 (water-intensity factors constant).
- IEA estimate for 2023: 560 billion L total data-centre water; 373 billion L indirect, 140 billion L direct, about 47 billion L hardware manufacturing.
- Grid water intensity: Apple US sites 2.84 L/kWh (Mesa, AZ) to 11.98 L/kWh (Maiden, NC); Meta's Iowa and Illinois sites 1.74 L/kWh.
- No company reports AI-specific metrics; PUE, WUE and indirect water reporting is inconsistent.
- Reported operator average WUE values include 0.15, 0.19, 0.30 and 1.61 m3/MWh.
- The paper concludes that the IEA may underestimate data-centre water use.
Using it in design
- Use location-specific grid water-intensity factors (L/kWh), not a national average, when calculating indirect water.
- Include AI or high-density load scenarios in water-footprint projections.
- Structure exports so a project can report electricity, PUE, WUE, direct and indirect water separately, the disclosure set this paper finds missing.
Monthly newsletter · free
Keep your reading list current
Once a month: new library sources, changes to Turkish regulations and upcoming data centre events.
SoSo CAD
Check cooling capacity alongside your design
Review zone heat loads, available capacity and the capacity balance after the largest unit is lost in SoSo CAD.
Request a demo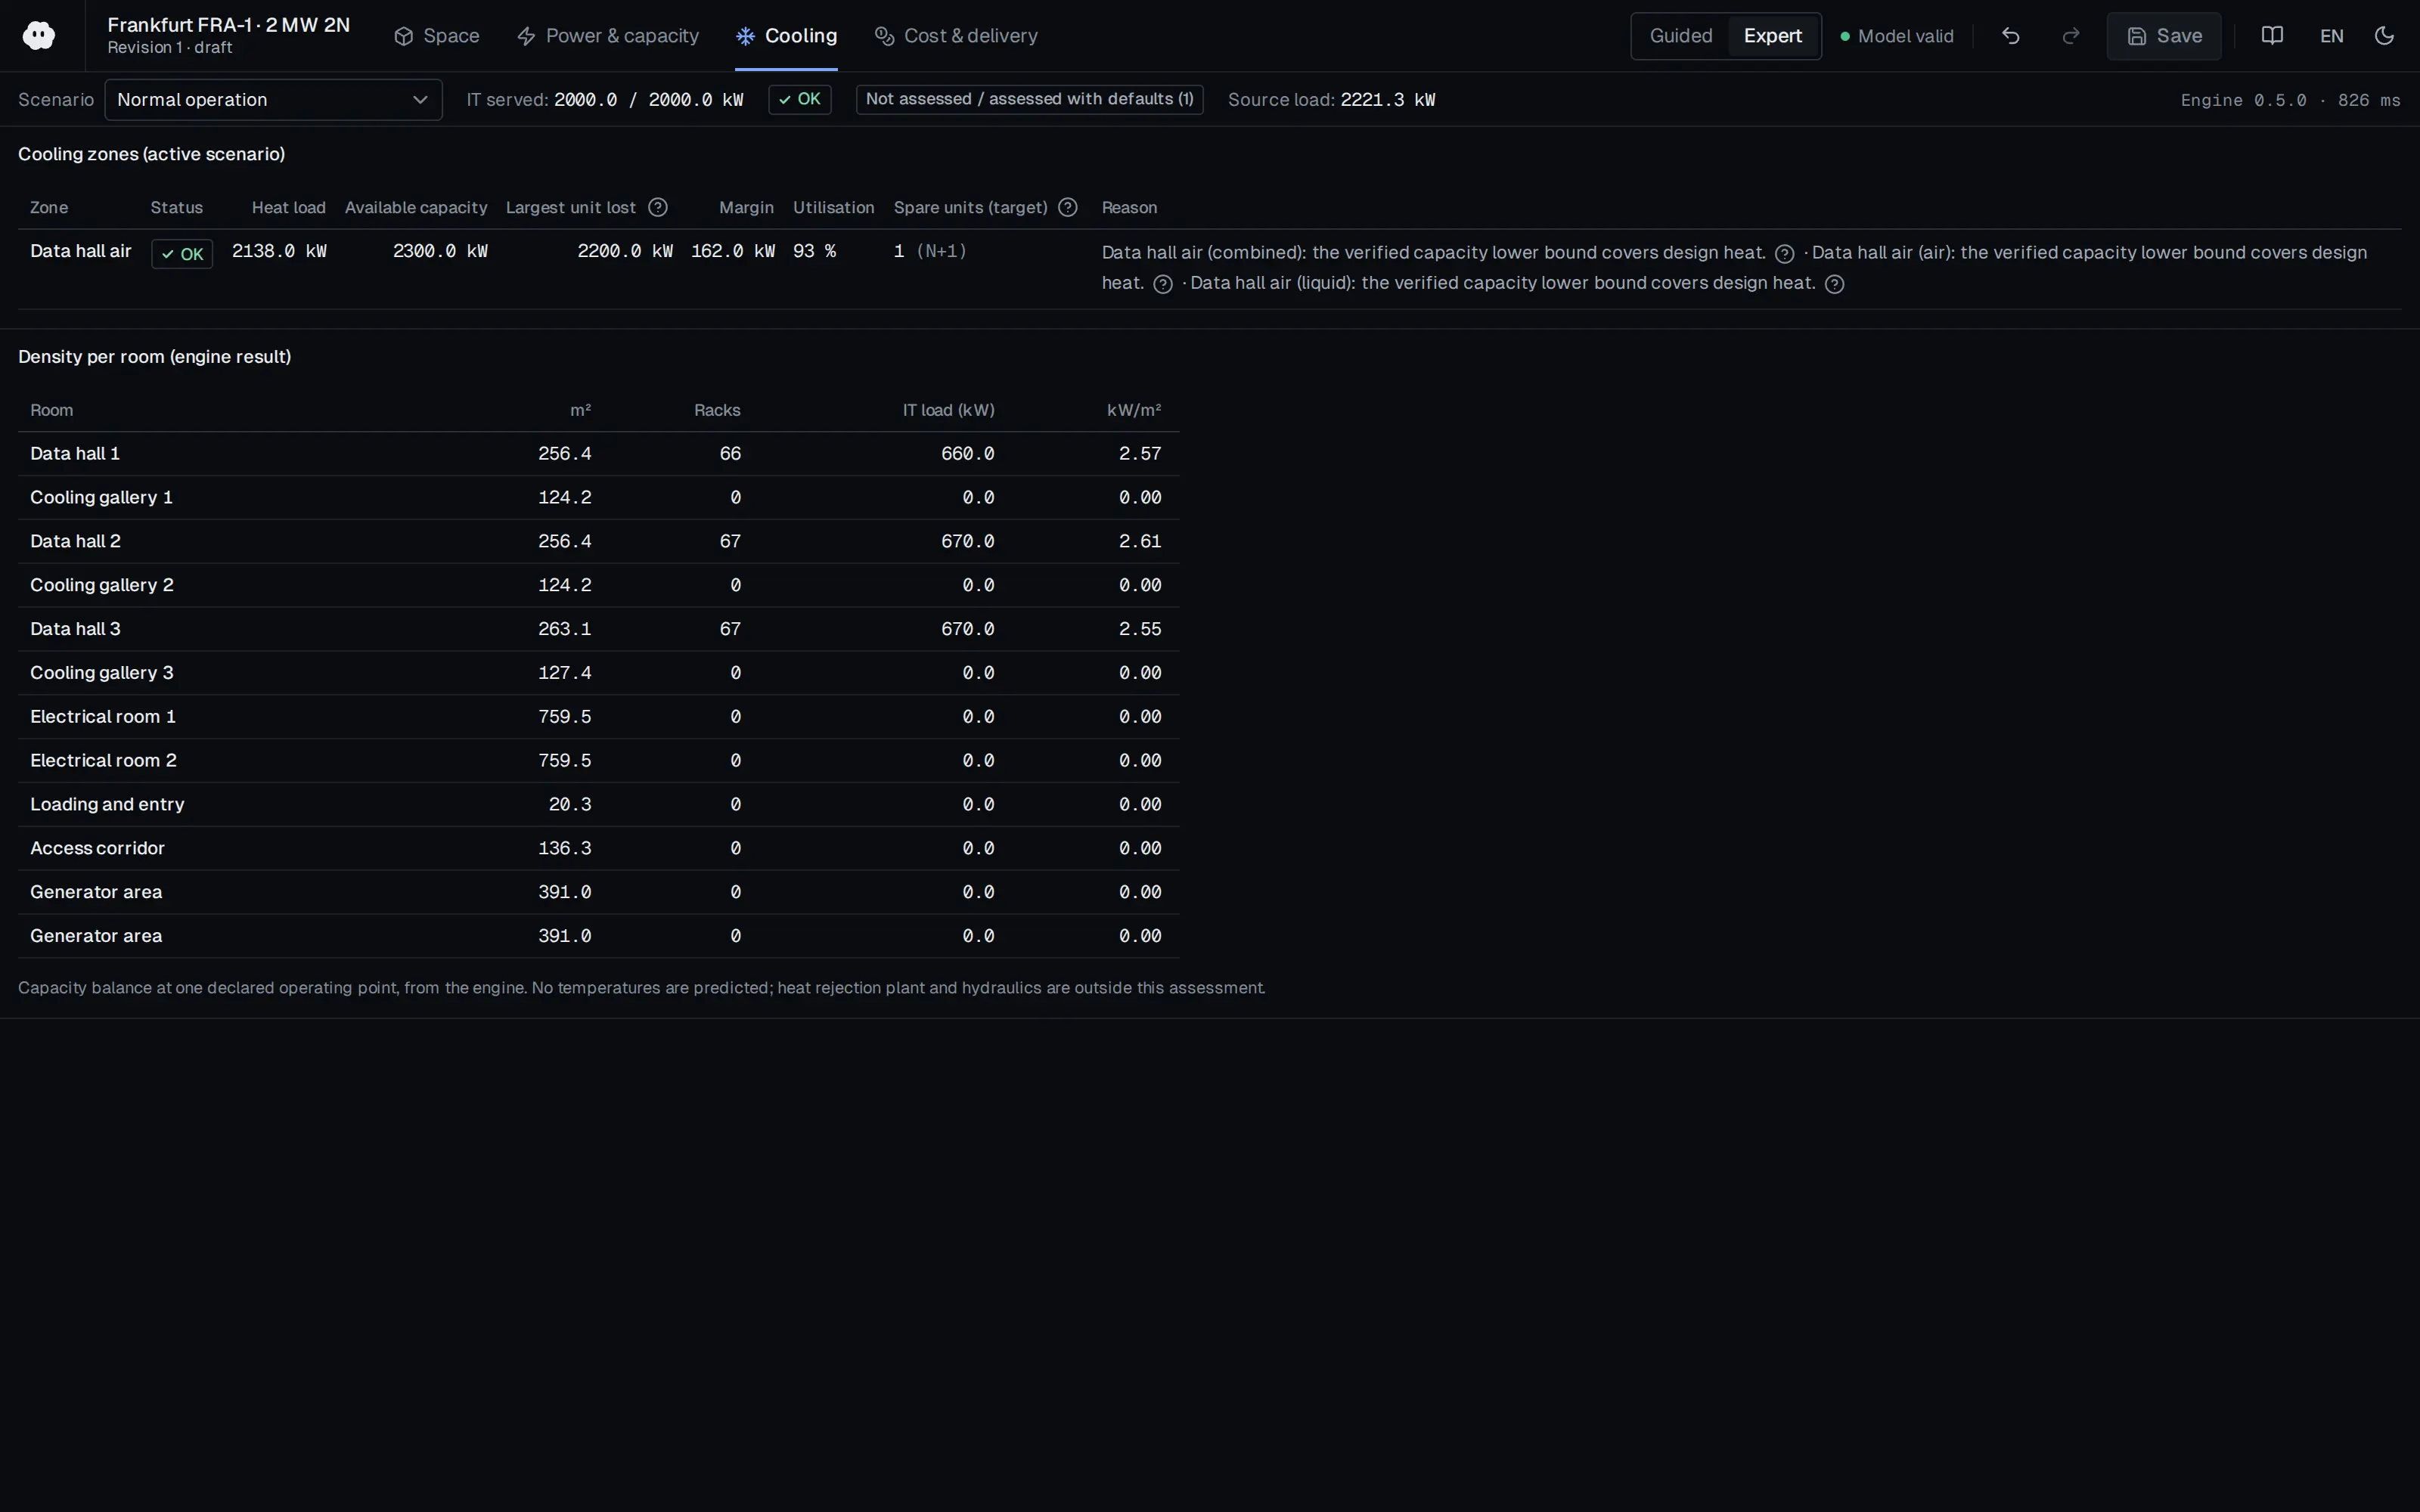
Who should read it
Sustainability specialists, designers and policymakers calculating data centre water and carbon footprints.
Related standards
- ISO/IEC 30134-9 (WUE)
Publication details
- Authors
- Alex de Vries-Gao
- Publisher
- Patterns (Elsevier BV)
- Year
- 2025
- Volume
- 7
- Issue
- 1
- Pages
- 101430
- Document language
- English
- Source type
- Scientific
- Access
- Free to read
- Licence
- CC BY 4.0 — share with attribution
Original licence note
CC BY 4.0 open-access article (read in full via Europe PMC PMC12827721). PDF not downloaded: the publisher and PMC PDF endpoints blocked automated retrieval.
Citation
Alex de Vries-Gao (2025). The carbon and water footprints of data centers and what this could mean for artificial intelligence. Patterns (Elsevier BV). 7(1), 101430. https://doi.org/10.1016/j.patter.2025.101430
Events on this subject
Browse the events calendarAll content and rights belong to the respective authors and publishers. SoSo CAD provides only the citation, its own summary and a link to the source, and is not responsible for the sources' content.
Related sources
All sources on this topic
Frontiers in Environmental Science (Frontiers Media SA) 2026
Net sustainability assessment of AI-driven data centers in the GCC: an MCDA approach framework
In AI data-centre investment assessment in hot, arid regions, weigh carbon, water, social and governance criteria together with explicit weights (0.40/0.25/0.20/0.15); indirect water (desalination energy) was about 0.68 times direct cooling water.
- In the extended boundary, embodied carbon adds 15-25% to the operational footprint.
Open Compute Project Foundation 2026
Guidelines: Impact of Strategies on Data Center Energy Consumption, Carbon Footprint, and Water Consumption (March 2026)
Evaluate cooling and siting options on energy, carbon, site water and water scarcity together, not on PUE or WUE alone.
- Same example: emissions fall from 3,500 to 2,700 t CO2/yr with the carbon factor of 0.26 kg CO2/kWh.
European Commission, DG Energy 2025
Assessment of the energy performance and sustainability of data centres in EU - First technical report (July 2025)
Compare your design PUE target with the real EU spread: 1.21 on average above 10 MW, 1.55 at 1-2 MW; set a realistic bound for your facility size.
- Rule of thumb cited: PUE below 1.2 excellent, 1.2-1.5 good, above 1.5 room for improvement.
European Commission, DG CNECT (EY, Borderstep Institute, AIT, RP legalitax) 2025
Synergies between Data Centres and Energy Systems - Final Report (European Commission, DG CNECT)
When choosing cooling architecture assess waste heat temperature early: liquid cooling gives higher temperatures, even air cooling can give about 30-35 C as a heat-pump source; position the heat pump for the receiving network temperature (60-80 C or 4th/5th generation).
- In the stakeholder survey, over 60% rated heat reuse technically viable today but only about 20% economically viable.
European Commission (Official Journal of the European Union) 2024
Commission Delegated Regulation (EU) 2024/1364 of 14 March 2024 on the first phase of the establishment of a common Union rating scheme for data centres
Build the metering architecture to the regulation: meters on every supply input for total energy (grid and back-up generator separately) and at every UPS output for IT energy, with a system that retains measurement point and device records for at least 10 years.
- Data centre electricity demand is projected to reach 3.2% of total EU demand by 2030, a 28% increase over 2018.
Open Compute Project Foundation 2024
Data Center Facility Sustainability Metrics (OCP Data Center Facility white paper, October 2, 2024)
Build the metering plan so that PUE can be reported at the highest category possible, with IT load measured at PDU or equipment input rather than the UPS output where feasible.
- External reporting is annual (required) and quarterly on a trailing 12 months (recommended); internal tracking should be continuous or monthly.