
Guidelines: Impact of Strategies on Data Center Energy Consumption, Carbon Footprint, and Water Consumption (March 2026)
Open Compute Project Foundation · Sean Barlett, Jaime Comella et al.
An OCP guideline on the trade-offs between energy, site and source water, carbon and water scarcity across data center cooling, siting and heat reuse strategies. It ends in qualitative summary tables and hypothetical 1 MW worked examples, not benchmarks.
CC BY-SA 4.0 — share with attribution under the same licence
On this page
Overview
The guideline argues that improving one metric often worsens another, so energy, carbon and water, including water scarcity, must be assessed together. It starts by categorising cooling. For the IT, air cooling still dominates, while liquid cooling, either direct-to-chip or immersion, is growing because AI training campuses have passed the gigawatt scale with racks above 100 kW. For the facility, heat moves through refrigerant, water or air, split into evaporative systems (direct and indirect evaporative coolers, water-cooled chillers with wet towers, chiller-less systems with wet towers) and non-evaporative ones (DX, air-cooled chillers, dry towers). Running the technology cooling loop at 40-50 °C is said to allow dry coolers almost everywhere for most of the year.
The energy and water chapter explains that non-evaporative systems use more electricity in hot weather while evaporative ones hold electricity steady but use more water as wet-bulb temperature rises, and that comparing design-day values is misleading. Economization is a mode of operation with air-side, water-side and refrigerant-based forms. Air-side economization achieves 85-95% of wet bulb depression, water-side with towers 70-75%, so air-side offers more hours. Total operational water includes on-site consumption (Scope 1) and water used to generate electricity (Scope 2). Water stress is handled through a water scarcity footprint, using the AWARE factor, and a proposed water scarcity usage effectiveness (WSUE), with facility location treated as a major factor.
Later sections cover energy and carbon for traditional and AI data centers, mitigation through reference designs, liquid cooling, strategic siting, power purchase agreements and workload optimisation, and waste heat reuse in two scenarios, unmodified heat and heat upgraded by compression. Waste heat can also support water reclamation and carbon recovery. Summary tables show each strategy as a major or minor increase or decrease in energy, carbon, water and scarcity. These are qualitative and the authors say many strategies improve one area at the cost of another. Values in the worked examples are described as illustrative, not measured.
The examples are 1 MW cases. In Phoenix, waterless CRAC cooling at PUE 1.6 (EWIF 8.3 L/kWh) is compared with evaporative cooling at PUE 1.2 and WUE 1.8 L/kWh, cutting Scope 1 and 2 water from 120 to 104 million L/yr and emissions from 3,500 to 2,700 t CO2/yr. Florida versus Colorado shows PUE 1.79 against 1.61, but water scarcity footprint of 30 versus 1,300 million L/yr and emissions of 12,400 versus 14,400 t. Heat recovery with vapor recompression and a LiBr absorption chiller (270 kW input, 510 kW cooling) and a DC distribution case (PUE 2.16 against 1.89 at 300 kW IT) complete the set.
Key points
- Running the technology cooling loop at 40-50 °C allows dry air coolers for most of the year almost everywhere, removing compression cooling.
- Air-side economization achieves 85-95% of wet bulb depression; water-side with evaporative towers 70-75%, so air-side offers more economizer hours.
- Non-evaporative systems use more electricity in hot weather; evaporative systems have steadier electricity but more water use as wet bulb rises.
- Total operational water adds on-site consumption (Scope 1) to water used in power generation (Scope 2, via the energy water intensity factor).
- Water scarcity footprint multiplies water footprint by a scarcity indicator such as AWARE; WSUE is proposed as scarcity-weighted water per IT energy.
- Phoenix example (1 MW): waterless CRAC at PUE 1.6 versus evaporative at PUE 1.2 and WUE 1.8 L/kWh cuts total Scope 1 and 2 water from 120 to 104 million L/yr.
- Same example: emissions fall from 3,500 to 2,700 t CO2/yr with the carbon factor of 0.26 kg CO2/kWh.
- Florida versus Colorado (1 MW): PUE 1.79 versus 1.61 saves 1.6 million kWh/yr, but water scarcity footprint is 30 versus 1,300 million L/yr and emissions 12,400 versus 14,400 t/yr.
- Waste heat recovery example: a 270 kW compressor plus LiBr absorption chiller gives 510 kW of cooling for other loads; a DC distribution example shows PUE 1.89 against 2.16.
- The worked examples are hypothetical and illustrative, not benchmarks; the summary tables are qualitative.
Using it in design
- Evaluate cooling and siting options on energy, carbon, site water and water scarcity together, not on PUE or WUE alone.
- Use the EWIF (for example 8.3 L/kWh at Phoenix in the paper) with PUE to add source water to site WUE when comparing waterless against evaporative cooling.
- Compare economization options by their share of wet-bulb depression and local climate, and select IT inlet or liquid temperatures that allow dry cooling for most hours.
- Add water scarcity weighting for the actual location before concluding that a cool, dry site is better.
- Explore waste heat reuse and its effect on mechanical cooling hours in the energy and water comparison.
- Run a worked 1 MW comparison with the paper's method before committing to a site or cooling concept, and replace its illustrative inputs with project data.
Monthly newsletter · free
Keep your reading list current
Once a month: new library sources, changes to Turkish regulations and upcoming data centre events.
SoSo CAD
Check cooling capacity alongside your design
Review zone heat loads, available capacity and the capacity balance after the largest unit is lost in SoSo CAD.
Request a demo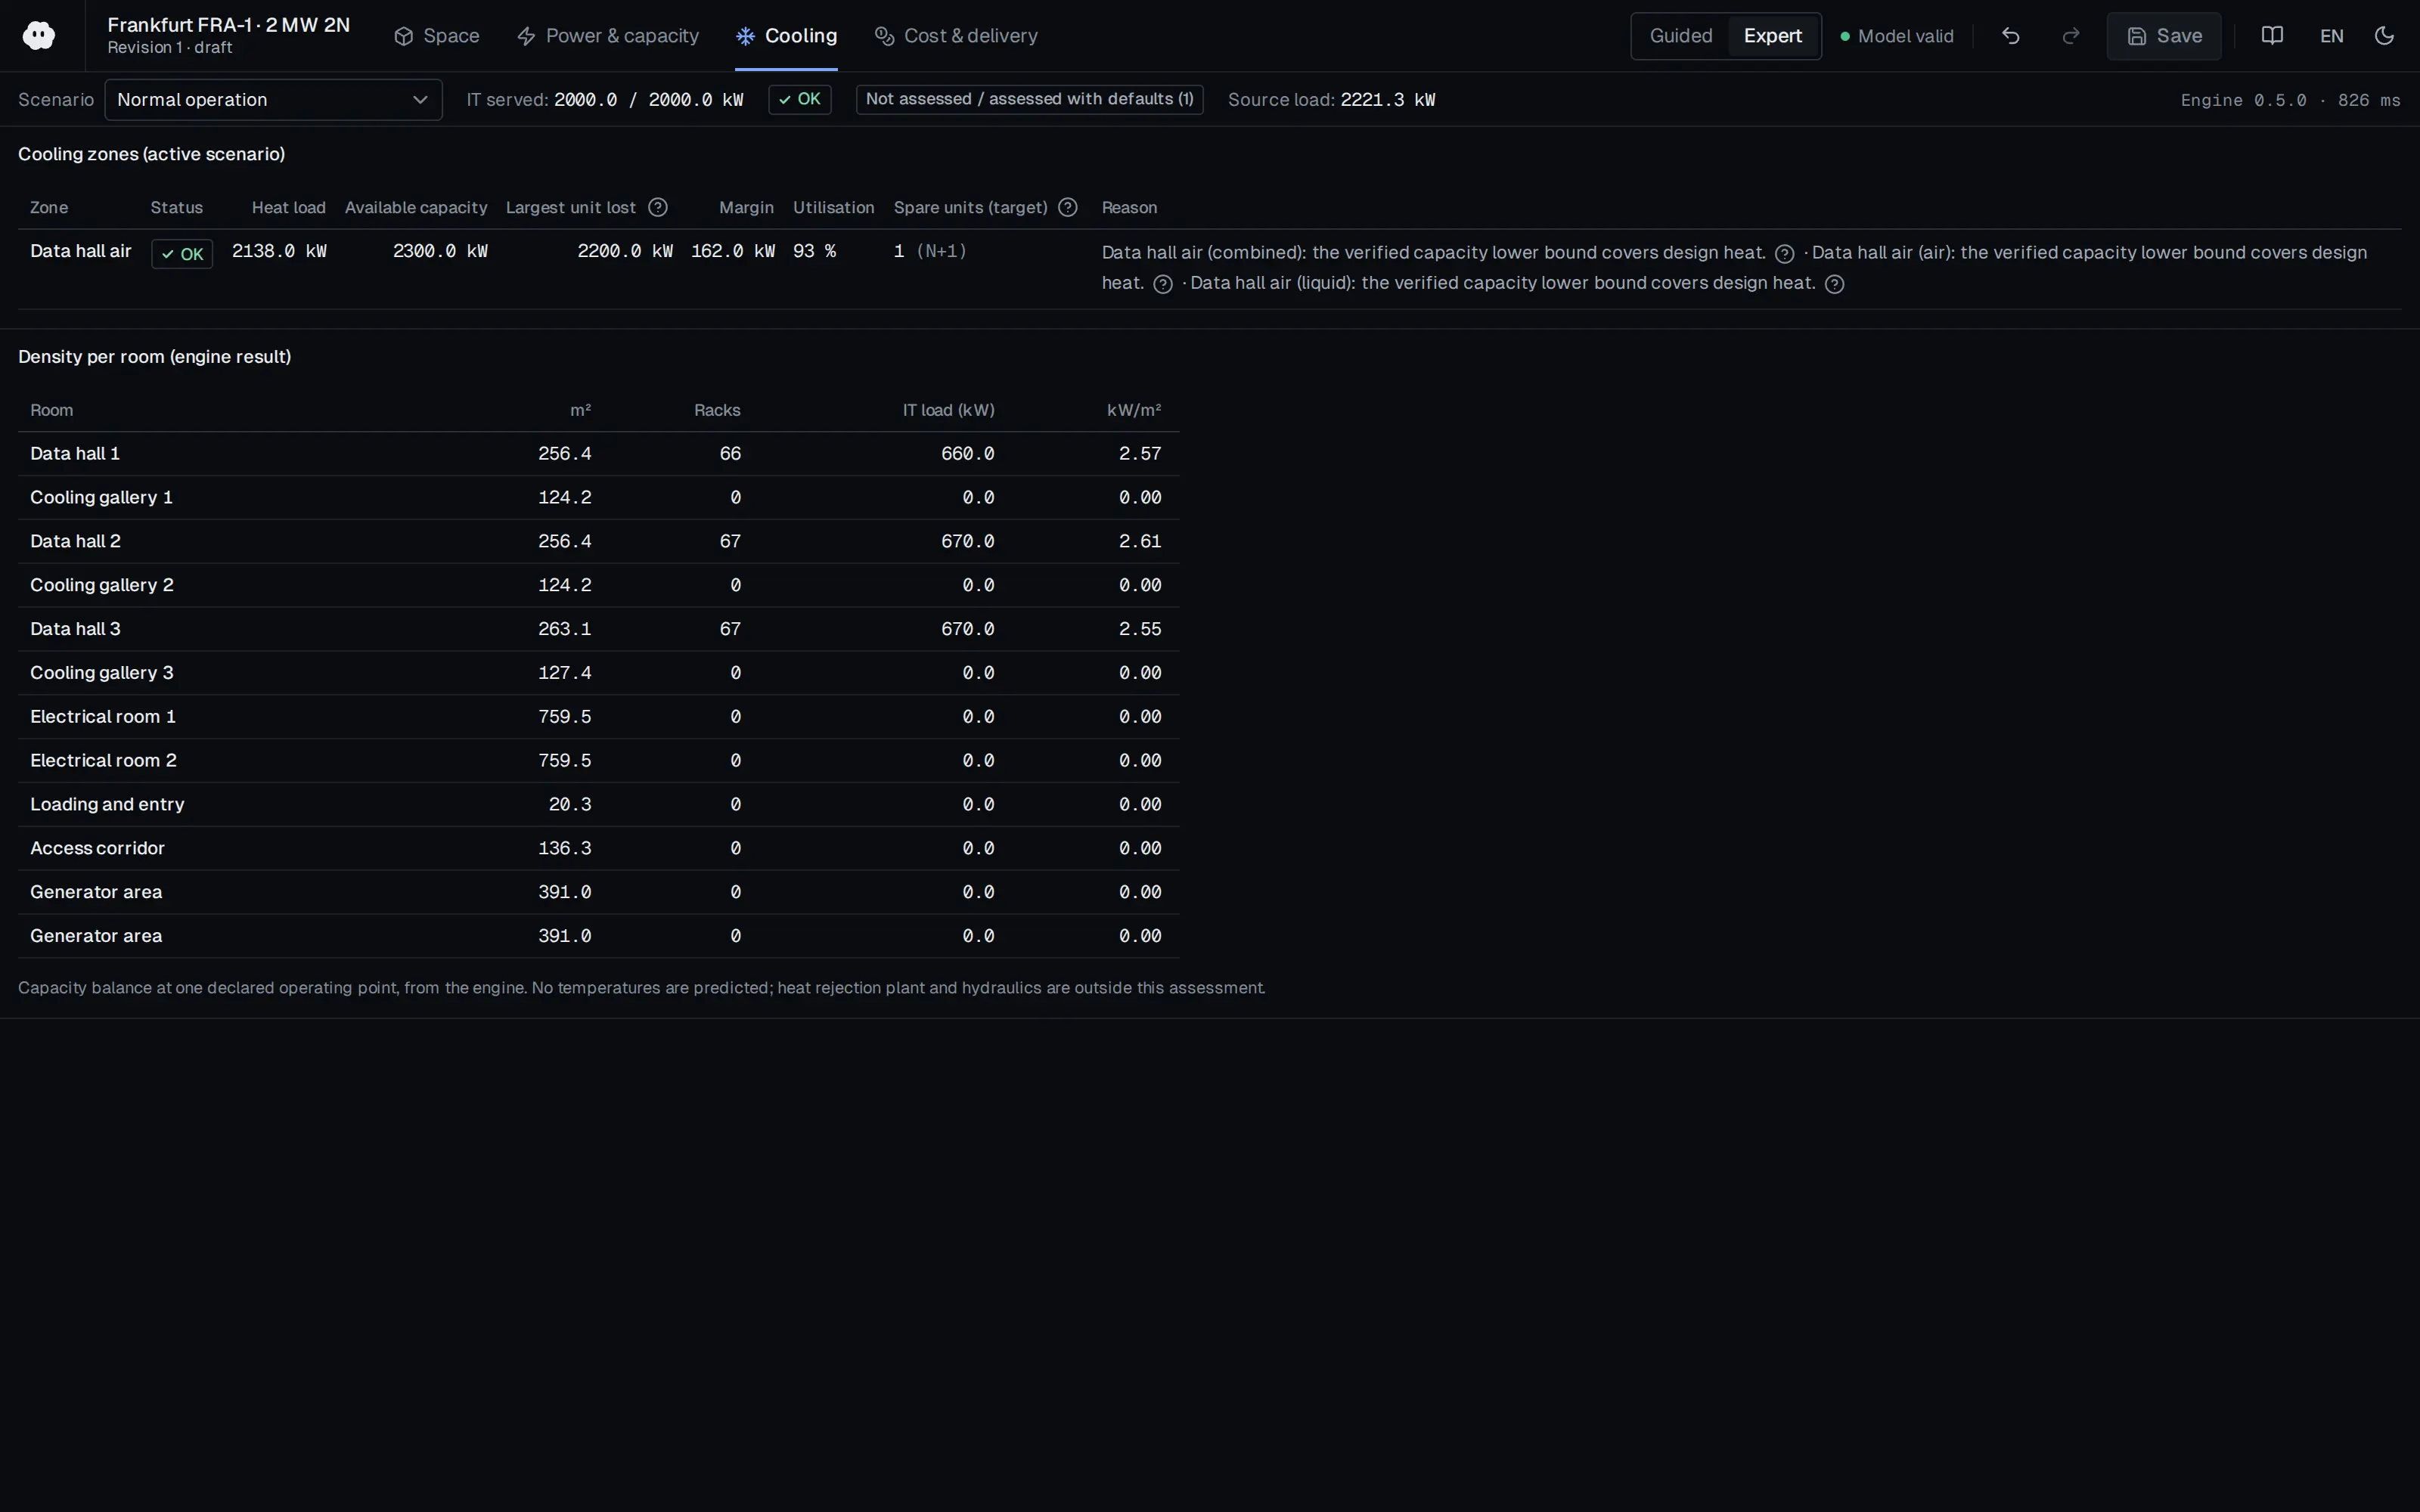
Who should read it
Planners, sustainability leads and mechanical designers comparing cooling, siting and heat reuse strategies against energy, carbon and water goals.
Document contents
- Executive Summary
- 1. Overview of Cooling Strategies
- 1.1 Cooling the ITE
- 1.1.1 Air-Based ITE Cooling
- 1.1.2 Liquid ITE Cooling
- 1.1.3 Other Cooling Strategies
- 1.2 Facility Cooling
- 2. Interplay Between Energy, Water, and Carbon
- 2.1 Relationship Between Energy and Water
- 2.1.2 Economization of Site Cooling Systems
- 2.1.4 Water Stress
- 2.1.5 Facility Location
- 2.2 Relationship Between Energy and Carbon Footprint
- 2.3 Relationship Between Waste Heat Reuse and Energy, Water, and Carbon
- 2.4 Summary Tables of Interplay
- 3. Examples to Illustrate Interplay
- 4. Compliance with Open Compute Project Tenets
- 5. Conclusion
- 6. Glossary
Read the document
ocp-dcf-water-heat-energy.pdf
CC BY-SA 4.0 — share with attribution under the same licence
The document is provided unaltered because its licence permits redistribution.
Publication details
- Authors
- Sean Barlett; Jaime Comella; Cosimo Pecchioli; Kially Ruiz; Aaron P. Wemhoff; Joel Zemanek
- Publisher
- Open Compute Project Foundation
- Year
- 2026
- Document language
- English
- Source type
- Industry body
- Access
- Open licence — downloadable
- Licence
- CC BY-SA 4.0 — share with attribution under the same licence
- Licence evidence
- www.opencompute.org
Original licence note
License section of the document states Creative Commons Attribution-ShareAlike 4.0. Attribution required; derivatives/adaptations must stay CC-BY-SA.
Citation
Sean Barlett; Jaime Comella; Cosimo Pecchioli; Kially Ruiz; Aaron P. Wemhoff; Joel Zemanek (2026). Guidelines: Impact of Strategies on Data Center Energy Consumption, Carbon Footprint, and Water Consumption (March 2026). Open Compute Project Foundation. https://www.opencompute.org/documents/dcf-water-heat-energy-2026march-pdf
Events on this subject
Browse the events calendarAll content and rights belong to the respective authors and publishers. SoSo CAD provides only the citation, its own summary and a link to the source, and is not responsible for the sources' content.
Related sources
All sources on this topicNortek Air Solutions 2021
Solutions to Water and Power Availability that Challenge the Future of Data Centers
In a site/sustainability module, estimate annual water (m3), WUE and cooling energy for alternative plant types at a chosen SAT, using local water and power tariffs.
- Case prices: water ~USD 2/m3, power ~USD 0.10/kWh.
Open Compute Project Foundation 2023
Data Centers Heat Reuse 101
A heat-reuse module should report recoverable heat (kW) and its temperature band by cooling technology (air, RDHx, DLC/immersion) and suggest compatible heat-host categories.
- Containerised/modular data centres can exceed 0.5 MW, a significant heat quantity for many local applications.
Frontiers in Environmental Science (Frontiers Media SA) 2026
Net sustainability assessment of AI-driven data centers in the GCC: an MCDA approach framework
In AI data-centre investment assessment in hot, arid regions, weigh carbon, water, social and governance criteria together with explicit weights (0.40/0.25/0.20/0.15); indirect water (desalination energy) was about 0.68 times direct cooling water.
- In the extended boundary, embodied carbon adds 15-25% to the operational footprint.
arXiv (University of Michigan preprint) 2026
Data Center Cooling Choices Shift Water Impacts Across the Grid: An Integrated Water-Energy Model for Sustainable Data Center Development
In cooling selection, calculate direct and indirect water together: an air-cooled chiller cut direct water 97% but raised the indirect share to 96.6% and electricity by 32%.
- Indirect water intensity varied by about 50% across months, depending on which generators supplied the added load.
European Commission, DG CNECT (EY, Borderstep Institute, AIT, RP legalitax) 2025
Synergies between Data Centres and Energy Systems - Final Report (European Commission, DG CNECT)
When choosing cooling architecture assess waste heat temperature early: liquid cooling gives higher temperatures, even air cooling can give about 30-35 C as a heat-pump source; position the heat pump for the receiving network temperature (60-80 C or 4th/5th generation).
- In the stakeholder survey, over 60% rated heat reuse technically viable today but only about 20% economically viable.
Google 2026
Google Data Centers — Operating sustainably (energy and water)
In the cooling-selection UX present an explicit energy-versus-water trade-off (PUE versus WUE) per site, with a water-stress input (for example a WRI Aqueduct category).
- 87% of 2025 freshwater withdrawal from sources at low or medium depletion/scarcity risk.