
Solutions to Water and Power Availability that Challenge the Future of Data Centers
Nortek Air Solutions · Philip LePoudre
Using a hypothetical 3 GW IT build-out in Singapore, this Nortek paper shows how the choice of cooling technology changes national water and electricity demand.
On this page
Overview
The paper starts from Singapore's resource baseline: about 606 million m3/yr of water and about 50 TWh/yr of electricity in 2019, with 2018 peak demand near 7,000 MW. A hypothetical 3 GW IT load is placed against it, comparing water-cooled and air-cooled chiller plants at 24 C supply air with StatePoint Liquid Cooling (SPLC) alone at 32 C SAT and SPLC with chiller trim.
On water, water-cooled chillers need about 1.9 L/kWh WUE and about 51 million m3 a year, while SPLC at 32 C SAT cuts that to about 1.09 L/kWh and 29 million m3. On energy, annualised pPUE at 24 C SAT is about 1.3 for water-cooled and about 1.4 for air-cooled chillers (6.8 and 9.8 TWh/yr), against about 1.12 pPUE and 2.3 TWh/yr for SPLC at 32 C.
As an efficiency measure, chiller COP is typically 3-7, SPLC 12-21 year-round, SPLC with water-cooled trim 8-16 and with air-cooled trim 6-14. At peak, 3 GW of IT on air-cooled chillers draws about 1,147 MW (16% of the national peak) versus about 800 MW water-cooled, and SPLC is far lower. The case study assumes water at about USD 2/m3 and power at about USD 0.10/kWh. The paper also describes SPLC operating modes and the membrane exchanger's water-quality benefits; the scenario is hypothetical and manufacturer-sourced.
Key points
- Singapore: ~606 million m3/yr water, ~50 TWh/yr electricity (2019); 2018 peak demand ~7,000 MW.
- 3 GW IT at 24 C SAT: water-cooled chillers ~1.9 L/kWh WUE and ~51 million m3/yr; SPLC at 32 C SAT ~1.09 L/kWh and ~29 million m3/yr.
- Annualised pPUE at 24 C SAT: water-cooled ~1.3, air-cooled ~1.4 (6.8 and 9.8 TWh/yr); SPLC at 32 C ~1.12 and ~2.3 TWh/yr.
- COP: chillers 3-7; SPLC 12-21; SPLC with water-cooled trim 8-16; with air-cooled trim 6-14.
- Peak power: air-cooled chillers ~1,147 MW (16% of national peak) versus ~800 MW water-cooled.
- Case prices: water ~USD 2/m3, power ~USD 0.10/kWh.
Using it in design
- In a site/sustainability module, estimate annual water (m3), WUE and cooling energy for alternative plant types at a chosen SAT, using local water and power tariffs.
- Flag sites where projected campus water or power use is a material share of local supply.
- Seed early-stage energy models with plant COP ranges by technology in the catalog.
Monthly newsletter · free
Keep your reading list current
Once a month: new library sources, changes to Turkish regulations and upcoming data centre events.
SoSo CAD
Check cooling capacity alongside your design
Review zone heat loads, available capacity and the capacity balance after the largest unit is lost in SoSo CAD.
Request a demo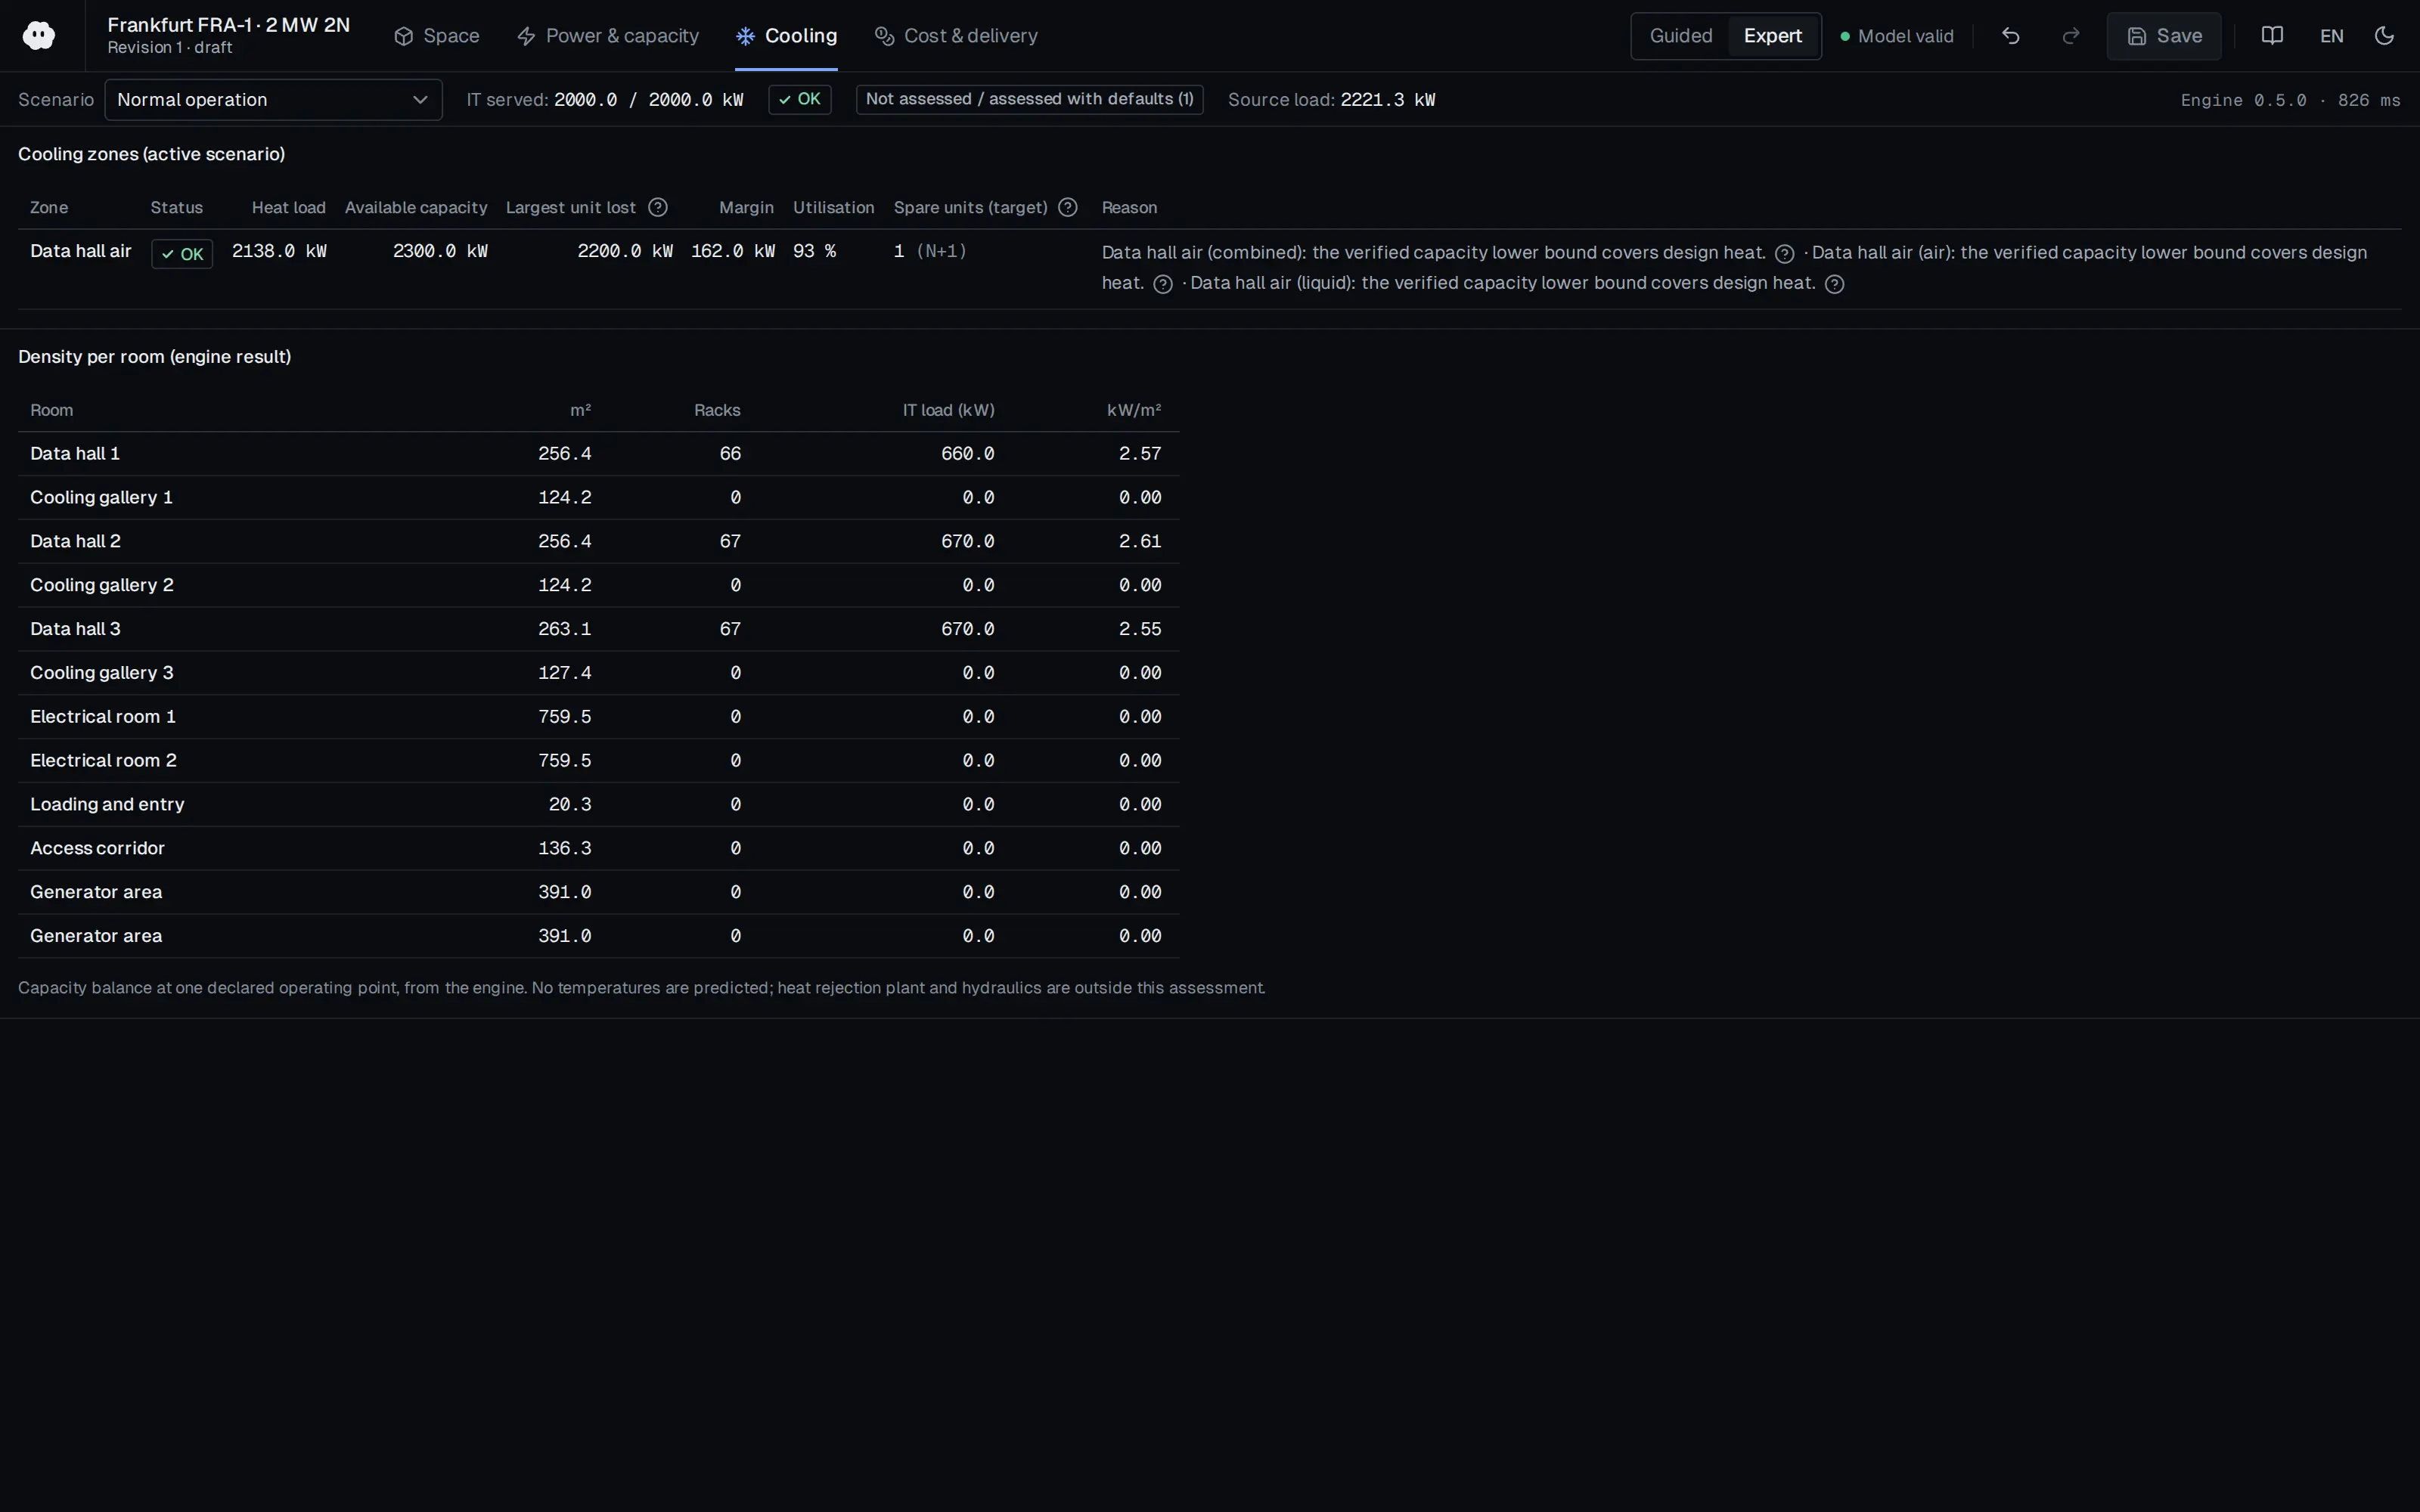
Who should read it
Planners and sustainability leads choosing a large-campus site and cooling technology.
Related standards
- ISO/IEC 30134-9
- ASHRAE TC 9.9 Thermal Guidelines
Publication details
- Authors
- Philip LePoudre
- Publisher
- Nortek Air Solutions
- Year
- 2021
- Document number
- 597f
- Document language
- English
- Source type
- Manufacturer
- Access
- Free to read
- Licence
- Copyright retained; citation only — the publisher’s terms apply to the original document
Citation
Philip LePoudre (2021). Solutions to Water and Power Availability that Challenge the Future of Data Centers. Nortek Air Solutions. 597f. https://www.nortekdatacenter.com/wp-content/uploads/2021/04/597f-StatePoint-Solutions-to-Water-and-Power-Availability.pdf
Events on this subject
Browse the events calendarAll content and rights belong to the respective authors and publishers. SoSo CAD provides only the citation, its own summary and a link to the source, and is not responsible for the sources' content.
Related sources
All sources on this topic
Open Compute Project Foundation 2026
Guidelines: Impact of Strategies on Data Center Energy Consumption, Carbon Footprint, and Water Consumption (March 2026)
Evaluate cooling and siting options on energy, carbon, site water and water scarcity together, not on PUE or WUE alone.
- Same example: emissions fall from 3,500 to 2,700 t CO2/yr with the carbon factor of 0.26 kg CO2/kWh.
Nortek Air Solutions 2021
Finding Sustainable Solutions to Data Center Power and Water Use
Support peak pPUE (electrical sizing, with N-x units offline at ASHRAE N50/N20 extremes) separately from annual pPUE/WUE (energy) in the cooling plant model.
- Frankfurt: 20 MW colocation, 12 StatePoint units at N+2.
Frontiers in Environmental Science (Frontiers Media SA) 2026
Net sustainability assessment of AI-driven data centers in the GCC: an MCDA approach framework
In AI data-centre investment assessment in hot, arid regions, weigh carbon, water, social and governance criteria together with explicit weights (0.40/0.25/0.20/0.15); indirect water (desalination energy) was about 0.68 times direct cooling water.
- In the extended boundary, embodied carbon adds 15-25% to the operational footprint.
arXiv (University of Michigan preprint) 2026
Data Center Cooling Choices Shift Water Impacts Across the Grid: An Integrated Water-Energy Model for Sustainable Data Center Development
In cooling selection, calculate direct and indirect water together: an air-cooled chiller cut direct water 97% but raised the indirect share to 96.6% and electricity by 32%.
- Indirect water intensity varied by about 50% across months, depending on which generators supplied the added load.
European Commission, DG CNECT (EY, Borderstep Institute, AIT, RP legalitax) 2025
Synergies between Data Centres and Energy Systems - Final Report (European Commission, DG CNECT)
When choosing cooling architecture assess waste heat temperature early: liquid cooling gives higher temperatures, even air cooling can give about 30-35 C as a heat-pump source; position the heat pump for the receiving network temperature (60-80 C or 4th/5th generation).
- In the stakeholder survey, over 60% rated heat reuse technically viable today but only about 20% economically viable.
Open Compute Project Foundation 2023
Data Centers Heat Reuse 101
A heat-reuse module should report recoverable heat (kW) and its temperature band by cooling technology (air, RDHx, DLC/immersion) and suggest compatible heat-host categories.
- Containerised/modular data centres can exceed 0.5 MW, a significant heat quantity for many local applications.