
ENERGY STAR Score for Data Centers in the United States - Technical Reference (November 2014)
U.S. EPA / ENERGY STAR · U.S. EPA ENERGY STAR
The U.S. EPA technical reference explaining how the 1-100 data center ENERGY STAR score in Portfolio Manager is derived. It is the key source for understanding how a facility is ranked against peers and which measurements are required.
U.S. public domain — U.S. Government work; free to reuse
On this page
Overview
The document sets out the statistical basis of the ENERGY STAR score for spaces designed and equipped for high-density computing. The goal is a fair comparison of a property's energy performance with its peers, taking climate and business activity into account. The model predicts the energy use expected from a building's actual activity, compares it with measured use and yields a 1 to 100 percentile rank against the national population. The score was released in June 2010 and applies to individual buildings only, never to campuses.
The reference data come from an EPA survey run with industry bodies including Uptime Institute, Green Grid, 7x24 Exchange and AFCOM, because no sufficiently robust public dataset existed. Of 120 facilities with complete data, 108 metered IT energy at the UPS output, and 61 of those were stand-alone data centers. Stand-alone sites gave more robust data and more significant regression equations, so the analysis uses only those 61 properties.
The dependent variable is PUE in source kBtu: total energy divided by IT energy. Total energy covers every fuel, including chilled water and natural gas, not just electricity. Source energy use intensity was rejected because it varies widely across data centers and ignores IT equipment density. IT energy must be measured at the UPS output; metering at the PDU or nearer the racks would be more accurate, but it is not yet common enough, so a metric most operators can supply was chosen.
Candidate variables included building and data center floor area, Tier level, rack count, UPS utilisation, annual IT energy, building type, data center type, and heating and cooling degree days. Only annual IT energy proved significant: larger IT loads show lower average PUE, but the economy of scale levels off beyond 0.4 source TBtu. Climate had no significant effect because cooling is dominated by the internal IT load. Tier was excluded as not significant, hard to define, and likely to reward needlessly high Tier levels.
The report provides the regression results, the full score lookup table from 1 to 100 and a worked calculation. Its limits are plain: the model rests on 2010 survey data, the sample is small, and the site-to-source factor for electricity may have changed since. Its value to a designer lies in translating a target PUE into an expected score and in showing that the metering architecture, with IT energy measured at the UPS output, must be planned from the start.
Key points
- The score was first released in June 2010 and covers individual buildings only; co-located data centers can each score, but a campus cannot.
- After filtering, the regression dataset holds 61 stand-alone data centers, from 120 properties with complete data and 108 with IT energy metered at the UPS output.
- PUE is defined as total energy divided by IT energy, both in source kBtu, with IT energy measured at the UPS output.
- The prediction equation has a constant of 1.924 and a coefficient of -0.9506 on centred annual IT energy in TBtu; the mean is 0.2091 TBtu.
- The IT energy adjustment is capped at 0.4 source TBtu; larger sites receive the same adjustment.
- The equation explains 11.38% of PUE variance (R2 = 0.1138) but 92.2% of the variation in data center source energy.
- No statistically significant relationship was found between heating or cooling degree days and PUE, nor between Tier level and PUE.
- The worked example uses a site-to-source multiplier of 3.14 for electricity and 1.05 for natural gas; 15,000,000 kWh total with 8,500,000 kWh IT gives an actual source PUE of 1.788.
- An efficiency ratio (actual PUE / predicted PUE) of 0.8781 earns a score of 71; ratios above 1.3315 score 1.
- The data date from a 2010 survey and site-to-source factors may have changed, so treat the results as a method reference rather than a current benchmark.
Using it in design
- Design sub-metering for IT energy at the UPS output and feed it into monitoring with monthly records; this is a precondition for the score.
- Use the prediction equation and lookup table to see what score a target PUE would earn; for example, a source PUE about 12% below prediction corresponds to a score near 71.
- Meter non-electric energy inputs such as chilled water and natural gas as well; they count towards total energy.
- Set redundancy level by business need, knowing that a higher Tier gives no scoring advantage and the score does not normalise for it.
- When comparing small and large sites, keep source-energy IT load as the common denominator and remember the scale effect stops at 0.4 TBtu.
Monthly newsletter · free
Keep your reading list current
Once a month: new library sources, changes to Turkish regulations and upcoming data centre events.
SoSo CAD
Compare the cost of design decisions
Evaluate equipment costs, energy expenses and total cost of ownership (TCO) using your inputs and assumptions in SoSo CAD.
Request a demo
Who should read it
Designers, operations teams and sustainability staff who want to benchmark data center energy performance, set up metering or translate a PUE target into a score.
Document contents
- Overview
- Reference Data & Filters
- Variables Analyzed
- Dependent Variable
- Independent Variables
- IT Energy Analysis
- Testing and Variables not Correlated with PUE
- Regression Equation Results
- ENERGY STAR Score Lookup Table
- Example Calculation
Read the document
energystar-dc-score-techref.pdf
U.S. public domain — U.S. Government work; free to reuse
The document is provided unaltered because its licence permits redistribution.
Publication details
- Authors
- U.S. EPA ENERGY STAR
- Publisher
- U.S. EPA / ENERGY STAR
- Year
- 2014
- Document language
- English
- Source type
- Government / public
- Access
- Open licence — downloadable
- Licence
- U.S. public domain — U.S. Government work; free to reuse
- Licence evidence
- www.copyright.gov
Original licence note
Published by U.S. EPA (ENERGY STAR program); U.S. Government work.
Citation
U.S. EPA ENERGY STAR (2014). ENERGY STAR Score for Data Centers in the United States - Technical Reference (November 2014). U.S. EPA / ENERGY STAR. https://www.energystar.gov/sites/default/files/tools/Data%20Centers.pdf
Events on this subject
Browse the events calendarAll content and rights belong to the respective authors and publishers. SoSo CAD provides only the citation, its own summary and a link to the source, and is not responsible for the sources' content.
Related sources
All sources on this topicU.S. Environmental Protection Agency (ENERGY STAR) 2026
Data Centers for Utilities (ENERGY STAR)
In the cost model, attach utility incentive data (rebates) to measures such as efficient UPS, containment and economizers.
- A cited 2016 study put downtime cost at $9,000 per minute, driving risk-averse over-redundancy.
U.S. DOE FEMP 2025
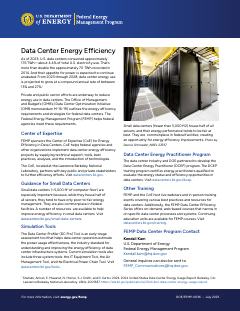
Data Center Energy Efficiency (Fact Sheet DOE/FEMP-0036, July 2025)
For a small data center or server room, write metering, air management and monitoring requirements into the specification from the start, given that energy management in this class tends to be poor.
- Data center energy use is projected to grow 13% to 27% per year (CAGR) from 2023 through 2028.
arXiv preprint (cs.SE), Google 2024
Carbon accounting in the Cloud: a methodology for allocating emissions across data center users
In allocating carbon to data-centre users, give idle power to whoever holds the resource allocation and share dynamic power by actual usage; because an idle server draws about 45% of peak power, the idle share is large.
- Resources with equivalent busy power used to weight idle-power allocation: 1 Intel Skylake N1 CPU core = 20 GiB RAM = 1 TiB SSD = 6 TiB HDD.
European Commission (Official Journal of the European Union) 2024
Commission Delegated Regulation (EU) 2024/1364 of 14 March 2024 on the first phase of the establishment of a common Union rating scheme for data centres
Build the metering architecture to the regulation: meters on every supply input for total energy (grid and back-up generator separately) and at every UPS output for IT energy, with a system that retains measurement point and device records for at least 10 years.
- Data centre electricity demand is projected to reach 3.2% of total EU demand by 2030, a 28% increase over 2018.
Uptime Institute 2025
Uptime Institute Global Data Center Survey 2025 (15th annual) — press release and public highlights
Use PUE 1.54 as the 'industry average' line on the efficiency dashboard, year-stamped and user-overridable
- Survey run April-May 2025 with 800+ respondents
IEEE Transactions on Sustainable Computing (Institute of Electrical and Electronics Engineers (IEEE)) 2025
xPUE: Extending Power Usage Effectiveness Metrics for Cloud Infrastructures
Do not present facility PUE as the whole efficiency story: add an optional server-overhead factor (sPUE) to the energy model and show an 'effective PUE' = PUE x sPUE next to PUE.
- Idle servers gave sPUE > 4; on a Dell R640 under rising CPU load the average sPUE was 3.1 and the lowest 2.7.