
xPUE: Extending Power Usage Effectiveness Metrics for Cloud Infrastructures
IEEE Transactions on Sustainable Computing (Institute of Electrical and Electronics Engineers (IEEE)) · Guillaume Fieni, Romain Rouvoy et al.
A paper by Fieni, Rouvoy and Seinturier arguing that facility PUE stops at the server power inlet and hides losses inside servers and the cloud software stack, and proposing the sPUE, vPUE, cPUE and gPUE metrics.
On this page
Overview
This paper, by Guillaume Fieni, Romain Rouvoy and Lionel Seinturier, was published in IEEE Transactions on Sustainable Computing in 2025 (pages 1-13, DOI 10.1109/TSUSC.2025.3549687, arXiv:2503.07124). The authors argue that facility PUE stops at the server power inlet and therefore hides losses inside servers (fans, power supplies, idle draw) and in the cloud software stack. They also stress that PUE counts only energy and not useful computational output.
The authors formalise server PUE (sPUE): server input energy divided by the energy of computing components such as CPU, DRAM, GPU and disks. A virtual PUE (vPUE) is defined for platform overhead. These multiply into a cloud PUE (cPUE) and, combined with facility PUE, a global gPUE: gPUE = cPUE x PUE and gCUE = cPUE x CUE, with gWUE = cPUE x WUE proposed by analogy. For measurement they used hardware power meters, IPMI, RAPL and a software power meter on Grid'5000 and OVHcloud servers.
The results show that idle servers gave an sPUE above 4. On a Dell R640 (Xeon Gold 5220) under rising CPU load the average sPUE was 3.1 and the lowest reached was 2.7. The best sPUE (1.4) came from an OVHcloud water-cooled server with a single AMD CPU; the authors attribute part of the liquid-cooling benefit to removing server fans, which PUE does not capture. At cluster scale (5 nodes), idle platforms gave sPUE above 20 (max 22.6 Kubernetes, 27.5 OpenStack).
In the software layer, OpenStack services took about 20% of energy (aggregated vPUE 1.25); combined with sPUE 2.7 the cPUE was 3.375, meaning 1 W in a hosted VM implied 3.375 W at cluster level. gPUE values across OVHcloud sites were all above 1.8, and gCUE varied by a factor of 26. As a limit, the measurements belong to specific hardware and platforms; the results should be interpreted with their scope stated, not generalised.
Key points
- PUE can mechanically decrease by artificially increasing IT workload; it counts only energy and not useful computational output.
- sPUE = Energy(IT) / Energy(hardware components doing the computation: CPU, GPU, memory, disk, controllers); gPUE = cPUE x PUE, gCUE = cPUE x CUE; gWUE = cPUE x WUE proposed by analogy.
- Idle servers gave sPUE > 4; on a Dell R640 under rising CPU load the average sPUE was 3.1 and the lowest 2.7.
- The best sPUE (1.4) came from an OVHcloud water-cooled server with a single AMD CPU; part of the benefit is attributed to removing server fans.
- At cluster scale (5 nodes), idle platforms gave sPUE above 20 (max 22.6 Kubernetes, 27.5 OpenStack); the minimum was 2.9 and the stressed average 5 to 6.5 depending on platform.
- A ToR switch drew a near-constant 115.3 W regardless of workload; the authors recommend counting network equipment in the IT numerator of sPUE.
- OpenStack services took about 20% of energy (vPUE 1.25); with sPUE 2.7 the cPUE was 3.375; Kubernetes averaged vPUE 1.3 with an optimum of 1.1.
- gPUE across OVHcloud sites was always above 1.8; gCUE spanned a factor of 26 (48.75 to 1,262 eqCO2 per unit of computation).
Using it in design
- Do not present facility PUE as the whole efficiency story: add an optional server-overhead factor (sPUE) to the energy model and show an 'effective PUE' = PUE x sPUE next to PUE.
- Warn when the IT load is modelled at low utilisation, because server-level overheads rise steeply when idle.
- When comparing air vs liquid cooling, move server fan power out of the IT load for liquid-cooled racks so the comparison is not biased by where fan energy is counted.
- Count network gear as IT load and report the scope used for each metric.
Monthly newsletter · free
Keep your reading list current
Once a month: new library sources, changes to Turkish regulations and upcoming data centre events.
SoSo CAD
Compare the cost of design decisions
Evaluate equipment costs, energy expenses and total cost of ownership (TCO) using your inputs and assumptions in SoSo CAD.
Request a demo
Who should read it
Designers interpreting PUE and efficiency metrics, cloud and colocation operators, and sustainability reporters.
Related standards
- ISO/IEC 30134-2
Publication details
- Authors
- Guillaume Fieni; Romain Rouvoy; Lionel Seinturier
- Publisher
- IEEE Transactions on Sustainable Computing (Institute of Electrical and Electronics Engineers (IEEE))
- Year
- 2025
- Document number
- arXiv:2503.07124
- Pages
- 1-13
- Document language
- English
- Source type
- Scientific
- Access
- Free to read
- Licence
- arXiv distribution permission — reuse conditions remain with the rights holder
Original licence note
Read via arXiv preprint (default non-exclusive licence); journal version IEEE-copyrighted. Not redistributable.
Citation
Guillaume Fieni; Romain Rouvoy; Lionel Seinturier (2025). xPUE: Extending Power Usage Effectiveness Metrics for Cloud Infrastructures. IEEE Transactions on Sustainable Computing (Institute of Electrical and Electronics Engineers (IEEE)). arXiv:2503.07124. 1-13. https://doi.org/10.1109/TSUSC.2025.3549687
Events on this subject
Browse the events calendarAll content and rights belong to the respective authors and publishers. SoSo CAD provides only the citation, its own summary and a link to the source, and is not responsible for the sources' content.
Related sources
All sources on this topic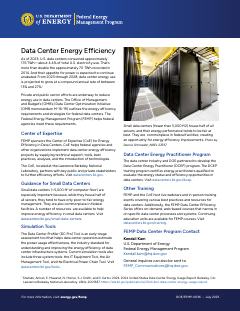
U.S. DOE FEMP 2025
Data Center Energy Efficiency (Fact Sheet DOE/FEMP-0036, July 2025)
For a small data center or server room, write metering, air management and monitoring requirements into the specification from the start, given that energy management in this class tends to be poor.
- Data center energy use is projected to grow 13% to 27% per year (CAGR) from 2023 through 2028.
arXiv preprint (cs.SE), Google 2024
Carbon accounting in the Cloud: a methodology for allocating emissions across data center users
In allocating carbon to data-centre users, give idle power to whoever holds the resource allocation and share dynamic power by actual usage; because an idle server draws about 45% of peak power, the idle share is large.
- Resources with equivalent busy power used to weight idle-power allocation: 1 Intel Skylake N1 CPU core = 20 GiB RAM = 1 TiB SSD = 6 TiB HDD.
European Commission (Official Journal of the European Union) 2024
Commission Delegated Regulation (EU) 2024/1364 of 14 March 2024 on the first phase of the establishment of a common Union rating scheme for data centres
Build the metering architecture to the regulation: meters on every supply input for total energy (grid and back-up generator separately) and at every UPS output for IT energy, with a system that retains measurement point and device records for at least 10 years.
- Data centre electricity demand is projected to reach 3.2% of total EU demand by 2030, a 28% increase over 2018.
U.S. EPA / ENERGY STAR 2014
ENERGY STAR Score for Data Centers in the United States - Technical Reference (November 2014)
Design sub-metering for IT energy at the UPS output and feed it into monitoring with monthly records; this is a precondition for the score.
- The IT energy adjustment is capped at 0.4 source TBtu; larger sites receive the same adjustment.
U.S. Environmental Protection Agency (ENERGY STAR) 2026
Data Centers for Utilities (ENERGY STAR)
In the cost model, attach utility incentive data (rebates) to measures such as efficient UPS, containment and economizers.
- A cited 2016 study put downtime cost at $9,000 per minute, driving risk-averse over-redundancy.
Uptime Institute 2025
Uptime Institute Global Data Center Survey 2025 (15th annual) — press release and public highlights
Use PUE 1.54 as the 'industry average' line on the efficiency dashboard, year-stamped and user-overridable
- Survey run April-May 2025 with 800+ respondents