
Energy performance analysis of multi-chiller cooling systems for data centers concerning progressive loading throughout the lifecycle under typical climates
Building Simulation (Springer Science and Business Media LLC) · Yingbo Zhang, Hangxin Li et al.
The study models a multi-chiller chilled-water plant with a waterside economiser for an air-cooled data centre using equipment test data and typical staging controls, across the full part-load range and Chinese climates from Hong Kong to Harbin and Ulanqab.
CC BY 4.0 — share with attribution
On this page
Overview
The rising demand for cooling energy is a global concern, but existing studies lacked a comprehensive analysis of the energy performance of widely used multi-chiller cooling systems in air-cooled data centres throughout their lifecycle, especially under progressive loading. Because IT load ramps up over the facility's life, the plant spends most of its life at part load, where chiller staging steps, oversized towers and switchover wet-bulb thresholds change free-cooling hours and system COP. Chilled-water supply is set at 13 °C, giving 20-22 °C supply air in line with the recommended 20-27 °C space temperature, with a 10 °C air temperature difference across computer rooms.
Free-cooling hours at part-load ratio (PLR) 1 ranged from 5921 h in Ulanqab to only 158 h in Hong Kong. The wet-bulb switchover from partial to full free cooling is 11 °C at PLR 0.3 but 8 °C at PLR 1, because towers are effectively oversized at low load; free-cooling hours can therefore differ by up to 1442 h between part-load ratios at one site. Cooling-system COP varies by up to 6 across part-load ratios, a PUE difference of up to 0.14, with sharp COP drops at PLR 0.25, 0.5 and 0.75 when extra equipment stages on.
With a progressive load ramp from 30% to 90% (Rasmussen profile), the lifecycle-average cooling-system COP in Beijing is only 11.7, 2.9 lower than the design COP. Climate performance is mainly set by the annual wet-bulb distribution, and extremely cold regions need freeze protection that can lower efficiency.
Limits: the study is confined to Chinese climates and specific equipment test data and typical staging controls; results may change with other equipment choices and control logic. It still shows that design-point COP is much higher than the lifecycle average.
Key points
- Chilled-water supply is set at 13 °C, giving 20-22 °C supply air in line with the recommended 20-27 °C space temperature, with a 10 °C air temperature difference across computer rooms.
- Free-cooling hours at PLR 1 ranged from 5921 h in Ulanqab to only 158 h in Hong Kong.
- The wet-bulb switchover from partial to full free cooling is 11 °C at PLR 0.3 but 8 °C at PLR 1, because towers are effectively oversized at low load; free-cooling hours can differ by up to 1442 h between part-load ratios at one site.
- Cooling-system COP varies by up to 6 across part-load ratios (a PUE difference of up to 0.14), with sharp COP drops at PLR 0.25, 0.5 and 0.75 when extra equipment stages on.
- With a progressive load ramp from 30% to 90% (Rasmussen profile), the lifecycle-average cooling-system COP in Beijing is only 11.7, 2.9 lower than the design COP.
- Climate performance is mainly set by the annual wet-bulb distribution; extremely cold regions need freeze protection that can lower efficiency.
Using it in design
- Calculate cooling plant efficiency from the lifecycle-average COP reflecting progressive IT load ramp rather than the design-point COP (in Beijing 2.9 lower than design).
- Add part-load review of chiller staging steps and towers (COP drops at PLR 0.25, 0.5, 0.75) to design verification; staging and tower size shift the free-cooling switchover threshold.
- Include the efficiency penalty of freeze protection in cold climates in the design energy model.
Monthly newsletter · free
Keep your reading list current
Once a month: new library sources, changes to Turkish regulations and upcoming data centre events.
SoSo CAD
Check cooling capacity alongside your design
Review zone heat loads, available capacity and the capacity balance after the largest unit is lost in SoSo CAD.
Request a demo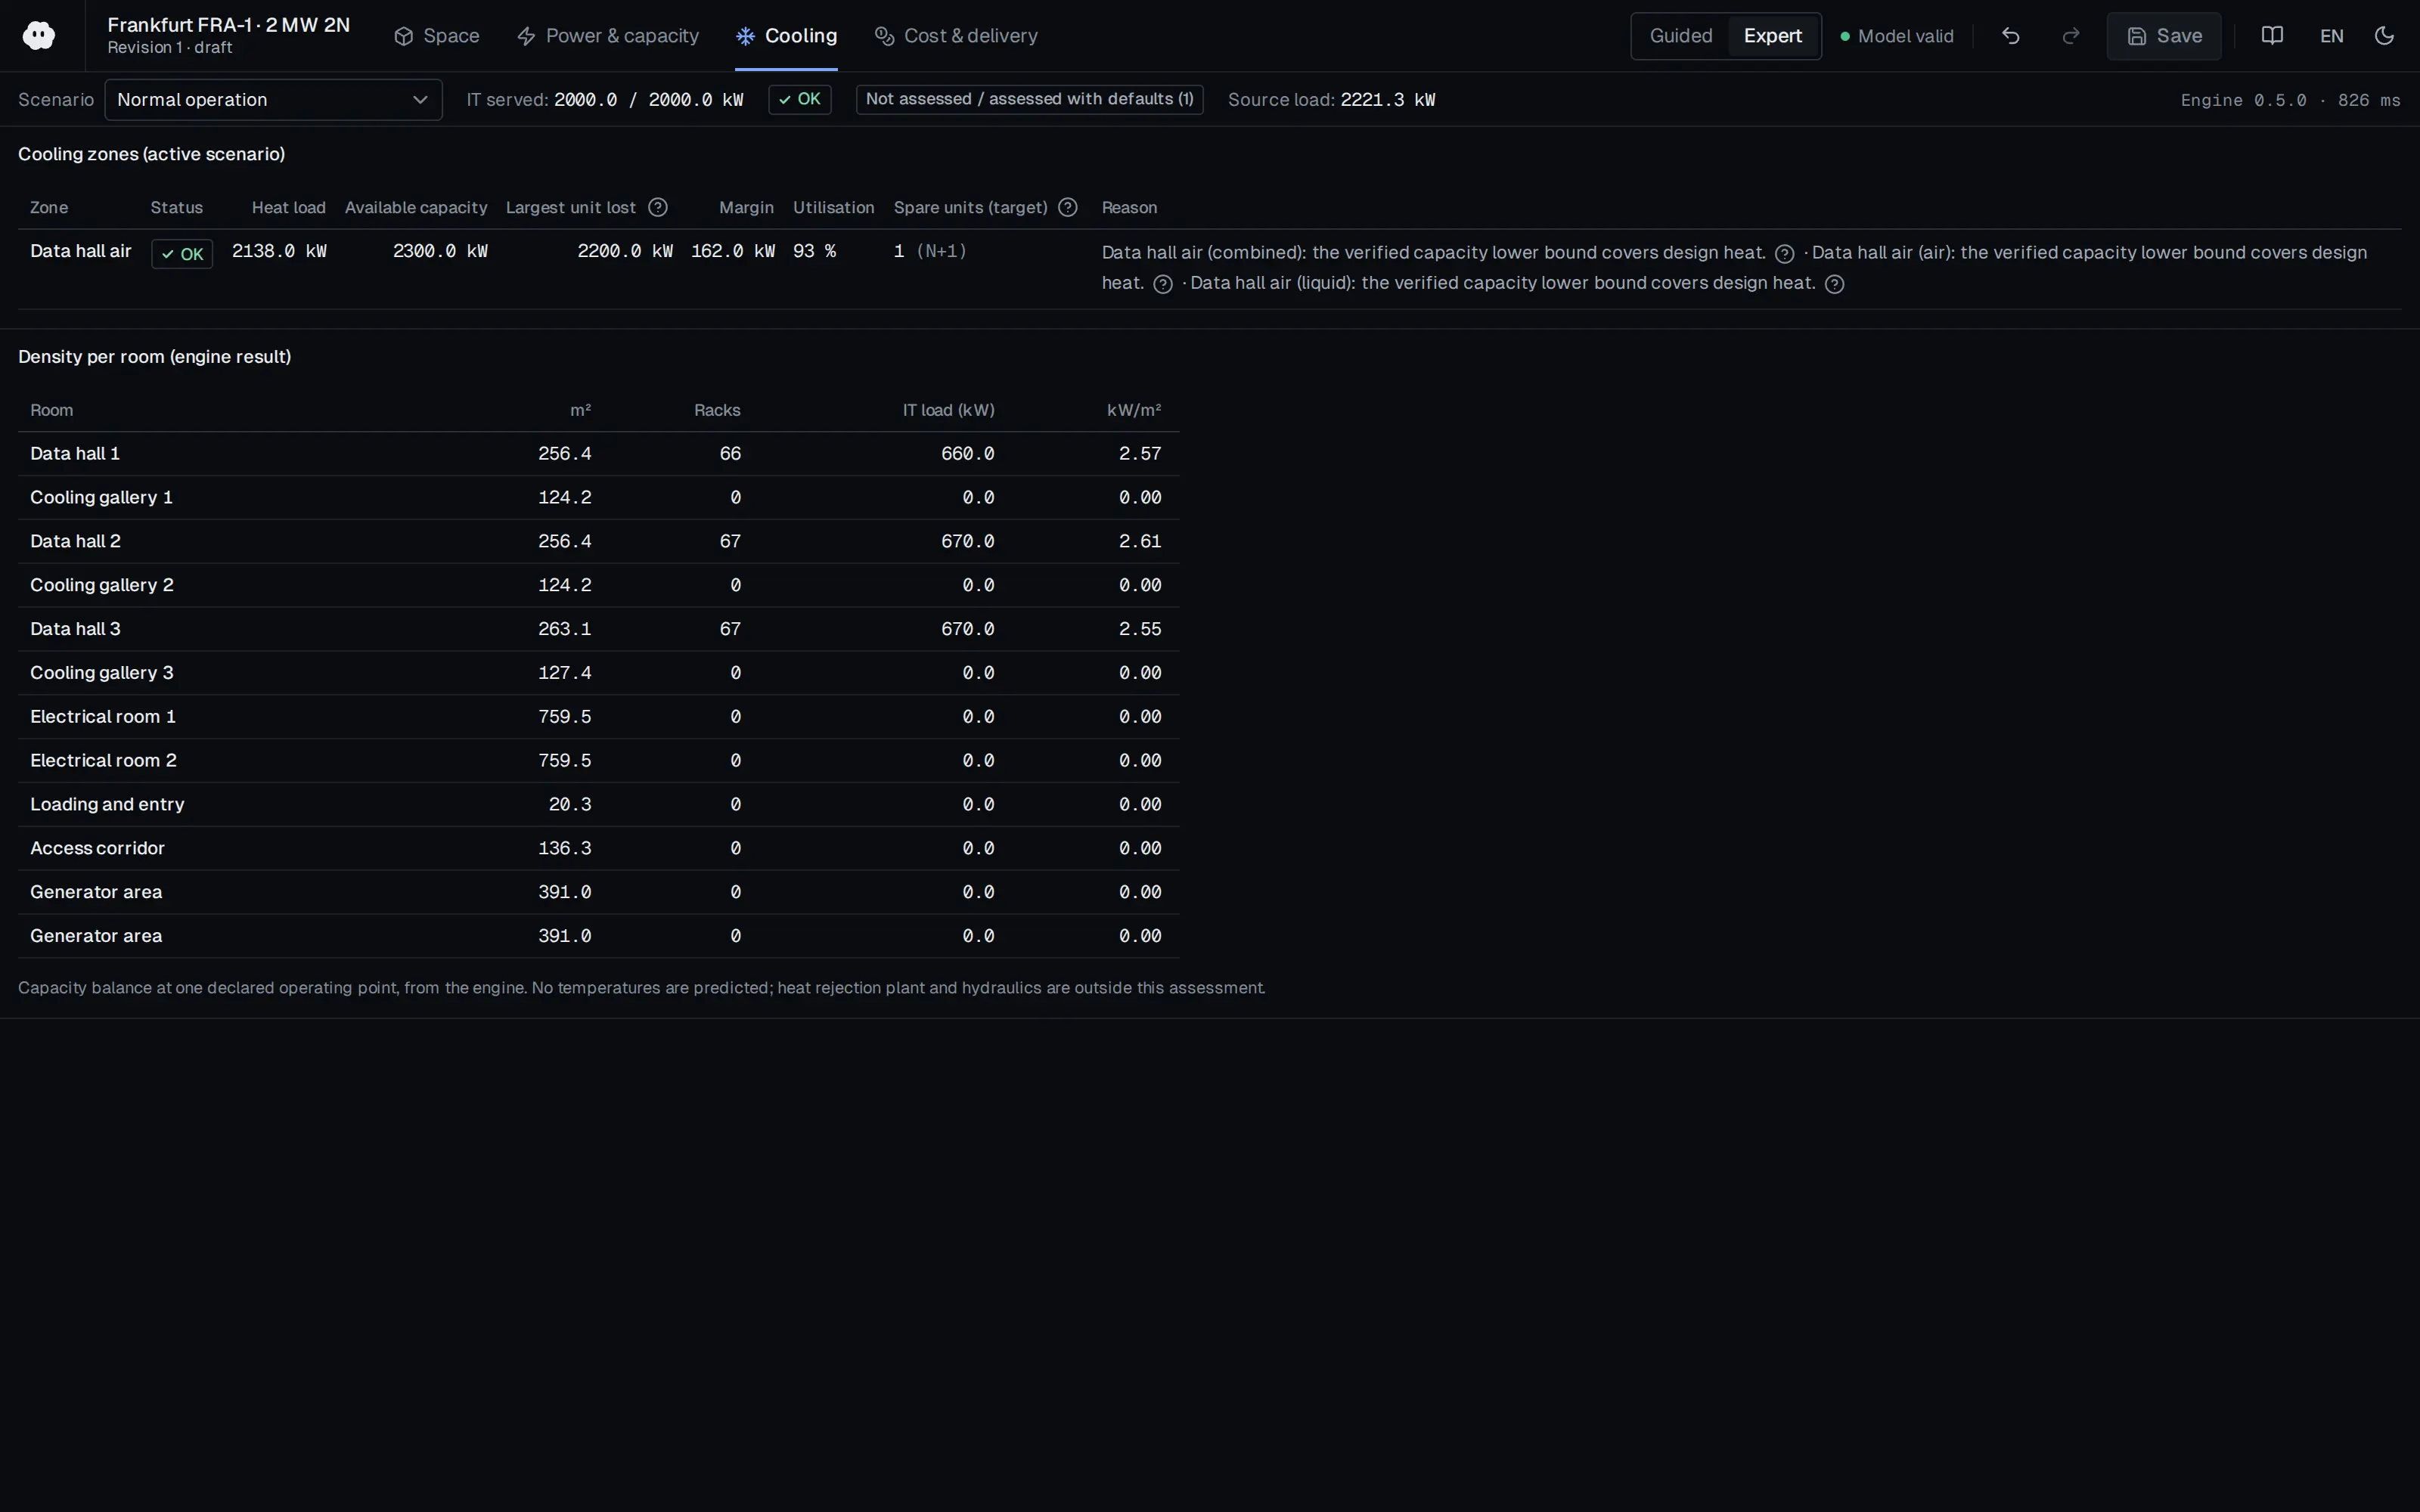
Who should read it
Cooling designers evaluating multi-chiller waterside-economiser plants under progressive loading and climate.
Document contents
- 1. Introduction
- 2. Methodology (2.1.2 Typical operation modes, 2.3.1 Cooling system designs for different climate conditions, 2.3.2 Data center energy flow and performance metrics)
- 3. Energy performance under full-range loads and progressive loading (3.2.1 Free cooling hour under full-range cooling loads, 3.2.2 Energy performance under full-range cooling loads, 3.2.3 Impact of climate condition on energy performance, 3.3 Life-cycle energy performance under progressive loading)
- 4. Discussion
- 5. Conclusions
Related standards
- ASHRAE TC9.9 Thermal Guidelines
- ASHRAE 90.4
Read the document
multi-chiller-progressive-loading-2024.pdf
CC BY 4.0 — share with attribution
The document is provided unaltered because its licence permits redistribution.
Publication details
- Authors
- Yingbo Zhang; Hangxin Li; Shengwei Wang
- Publisher
- Building Simulation (Springer Science and Business Media LLC)
- Year
- 2024
- Volume
- 17
- Issue
- 10
- Pages
- 1693-1708
- Document language
- English
- Source type
- Scientific
- Access
- Open licence — downloadable
- Licence
- CC BY 4.0 — share with attribution
- Licence evidence
- doi.org
Original licence note
Published version (PolyU institutional repository copy). The article is open access under a Creative Commons Attribution 4.0 International licence ('© Author(s) 2024'; the open-access statement on the last page gives the CC BY licence terms).
Citation
Yingbo Zhang; Hangxin Li; Shengwei Wang (2024). Energy performance analysis of multi-chiller cooling systems for data centers concerning progressive loading throughout the lifecycle under typical climates. Building Simulation (Springer Science and Business Media LLC). 17(10), 1693-1708. https://doi.org/10.1007/s12273-024-1167-9
Events on this subject
Browse the events calendarAll content and rights belong to the respective authors and publishers. SoSo CAD provides only the citation, its own summary and a link to the source, and is not responsible for the sources' content.
Related sources
All sources on this topic
IEEE Transactions on Cloud Computing (Institute of Electrical and Electronics Engineers (IEEE)) 2026
Coordinated Cooling and Compute Management for AI Datacenters
Design AI-hall cooling control together with workload management: when GPU count and tensor parallelism, DVFS and supply air temperature and airflow were optimised jointly, cooling energy fell by 31.2%.
- Cooling is cited as contributing approximately 45-50% of total energy consumption in AI data centres.
Buildings (MDPI AG) 2026
Load-Adaptive Operational Control of an Indirect Evaporative Cooling System for Coordinated Energy and Water Use in a Modular Data Center in a Cold Region
In IEC control, stage airflow to follow load rate and spray to follow room temperature, and prefer a low fresh/return air ratio.
- Going from load rate 0.7 to 1.0 raised annual electricity by 16.2% but water by 74.8% and WUE by 70.6%.
Applied System Innovation (MDPI AG) 2026
Proactive Cooling Control Algorithm for Data Centers Based on LSTM-Driven Predictive Thermal Analysis
For predictive cooling control, plan at least one inlet and one outlet temperature sensor per rack; below that, prediction error rose by about 22%.
- The LSTM uses a 60 min input window and a 30 min prediction horizon, with a reported RMSE of 0.25 and R² of 0.985.
European Commission JRC 2018
2018 Best Practice Guidelines for the EU Code of Conduct on Data Centre Energy Efficiency - Version 9.1.0 (JRC110666, EUR 29103 EN)
Keep the 2018 edition practices as a selectable compliance baseline for projects designed in 2018.
- 5.4.1.8 (value 5): investigate free cooling in all new builds and retrofits.
European Commission JRC 2017
2017 Best Practice Guidelines for the EU Code of Conduct on Data Centre Energy Efficiency - Version 8.1.0 (JRC104370, EUR 28426 EN)
Store the best practice edition and version against each design so the compliance checker evaluates practices from the edition in force at design date (8.1.0 for 2017 projects).
- 5.1.6: cabinet doors need at least 66% perforated area, with 80% considered ideal.
U.S. DOE FEMP 2010
Operations & Maintenance Best Practices: A Guide to Achieving Operational Efficiency, Release 3.0 (August 2010)
Choose maintenance strategy by equipment criticality: predictive for critical equipment with random failures, preventive for equipment subject to wear, reactive for small non-critical items; build a master equipment list and priority matrix.
- Boiler combustion tuning and related O&M can yield fuel savings of 2% to 20%.