
Operations & Maintenance Best Practices: A Guide to Achieving Operational Efficiency, Release 3.0 (August 2010)
U.S. DOE FEMP · G. P. Sullivan, R. Pugh et al.
FEMP's general-purpose guide to running operations and maintenance (O&M) programs for energy and water efficiency in federal buildings. It is a reference for data center teams on maintenance strategy, metering and chiller and cooling tower practice.
U.S. public domain — U.S. Government work; free to reuse
On this page
Overview
The guide estimates that energy-focused O&M programs can save 5% to 20% of energy bills without significant capital investment, and argues that low-cost or no-cost O&M measures should be considered before capital energy conservation measures. Reasons: most measures can be done by in-house staff, have immediate payback and need no design and bid process. If an energy savings performance contract (ESPC) is being considered, some retrocommissioning beforehand is advised, with the contractor informed, otherwise baselines may be inaccurate.
The maintenance chapter compares reactive, preventive, predictive and reliability-centered maintenance (RCM). More than 55% of maintenance resources at an average facility still go to reactive work (31% preventive, 12% predictive). Preventive maintenance is estimated to save 12% to 18% over reactive, and predictive 8% to 12% over preventive alone, with about 10x ROI, 25-30% lower maintenance cost, 70-75% fewer breakdowns and 35-45% less downtime. Top-performing facilities use under 10% reactive, 25-35% preventive and 45-55% predictive. Annual cost per horsepower is $18 for reactive, $13 preventive, $9 predictive and $6 for RCM.
The predictive technologies chapter covers thermography, lubricant and wear particle analysis, ultrasonic analysis, vibration analysis, motor analysis and performance trending. The commissioning chapter covers the process, typical findings and benefit tracking. The metering chapter stresses that meters are not an efficiency technology but data sources, with uses such as bill verification, cost allocation, demand response, measurement and verification, benchmarking and spotting opportunities, and that advanced meters should record at least hourly interval data. Chapters 3 and 4 cover O&M management, contracting and the computerized maintenance management system.
The equipment chapter gives checklists and savings calculations for boilers, steam traps, chillers, cooling towers, energy management and building automation systems, air handling, fans, pumps, motors, air compressors and lighting. On chillers, raising chilled water temperature 2-3 °F on a centrifugal chiller can raise system efficiency by 3% to 5%, and lowering condenser water temperature 2-3 °F by 2% to 3%. A poorly maintained cooling tower raises condenser temperature, and a chiller uses 2.5% to 3.5% more energy for each degree of increase. Boiler combustion tuning can save 2% to 20% fuel.
The guide is not data-center specific; it was written for federal buildings, Release 3.0 dates from August 2010, and the executive orders and targets it cites (such as EO 13514 and DOE Order 430.2B) belong to that period. Savings percentages are U.S. estimates and vary by site. The most useful parts for data center teams are maintenance strategy selection, the priority matrix, metering planning and chiller and tower operating practice. The final chapter offers a ten-step roadmap from management awareness to a first operational efficiency project and then to the next piece of equipment.
Key points
- Energy-focused O&M programs are estimated to save 5% to 20% of energy bills without significant capital investment.
- More than 55% of maintenance resources at an average facility are still spent on reactive maintenance (31% preventive, 12% predictive).
- Preventive maintenance is estimated to save 12% to 18% over reactive maintenance.
- Predictive maintenance is estimated to save 8% to 12% over preventive-only programs, with about 10x ROI, 25-30% lower maintenance cost, 70-75% fewer breakdowns and 35-45% less downtime.
- Top-performing facilities use under 10% reactive, 25% to 35% preventive and 45% to 55% predictive maintenance.
- Annual maintenance cost per horsepower: $18 reactive, $13 preventive, $9 predictive, $6 RCM.
- On a centrifugal chiller, raising chilled water temperature by 2-3 °F can increase system efficiency by 3% to 5%, and lowering condenser water temperature by 2-3 °F by 2% to 3%.
- A chiller uses 2.5% to 3.5% more energy for each degree increase in condenser temperature, and cooling tower neglect is a leading cause.
- Boiler combustion tuning and related O&M can yield fuel savings of 2% to 20%.
- Advanced meters should record at least hourly interval data and send it to a remote location; meters are data sources, not efficiency technologies in themselves.
Using it in design
- Choose maintenance strategy by equipment criticality: predictive for critical equipment with random failures, preventive for equipment subject to wear, reactive for small non-critical items; build a master equipment list and priority matrix.
- Plan measurement points and access for predictive techniques such as thermography, vibration, oil and ultrasonic analysis at design stage.
- In the chiller plant set the highest practical chilled water temperature and lowest practical condenser water temperature as operating goals; with a 2-5% efficiency effect per 2-3 °F, write setpoint optimisation into operating procedures.
- Include cooling tower maintenance (fouling and scale, water distribution, blowdown and concentration, fan start frequency, safe access) in the maintenance programme and contract, and calculate the energy cost of each degree of lost condenser temperature.
- Plan metering early: sub-meters, hourly or finer interval data, central monitoring, and requirements for bill verification, cost allocation and measurement and verification.
- Specify commissioning and retrocommissioning for new and existing equipment together; responsibility gaps often arise at control system interfaces.
Monthly newsletter · free
Keep your reading list current
Once a month: new library sources, changes to Turkish regulations and upcoming data centre events.
SoSo CAD
Assess redundancy through scenarios
Compare normal operation and equipment failures in SoSo CAD, with supplied loads and capacity shortfalls in one view.
Request a demo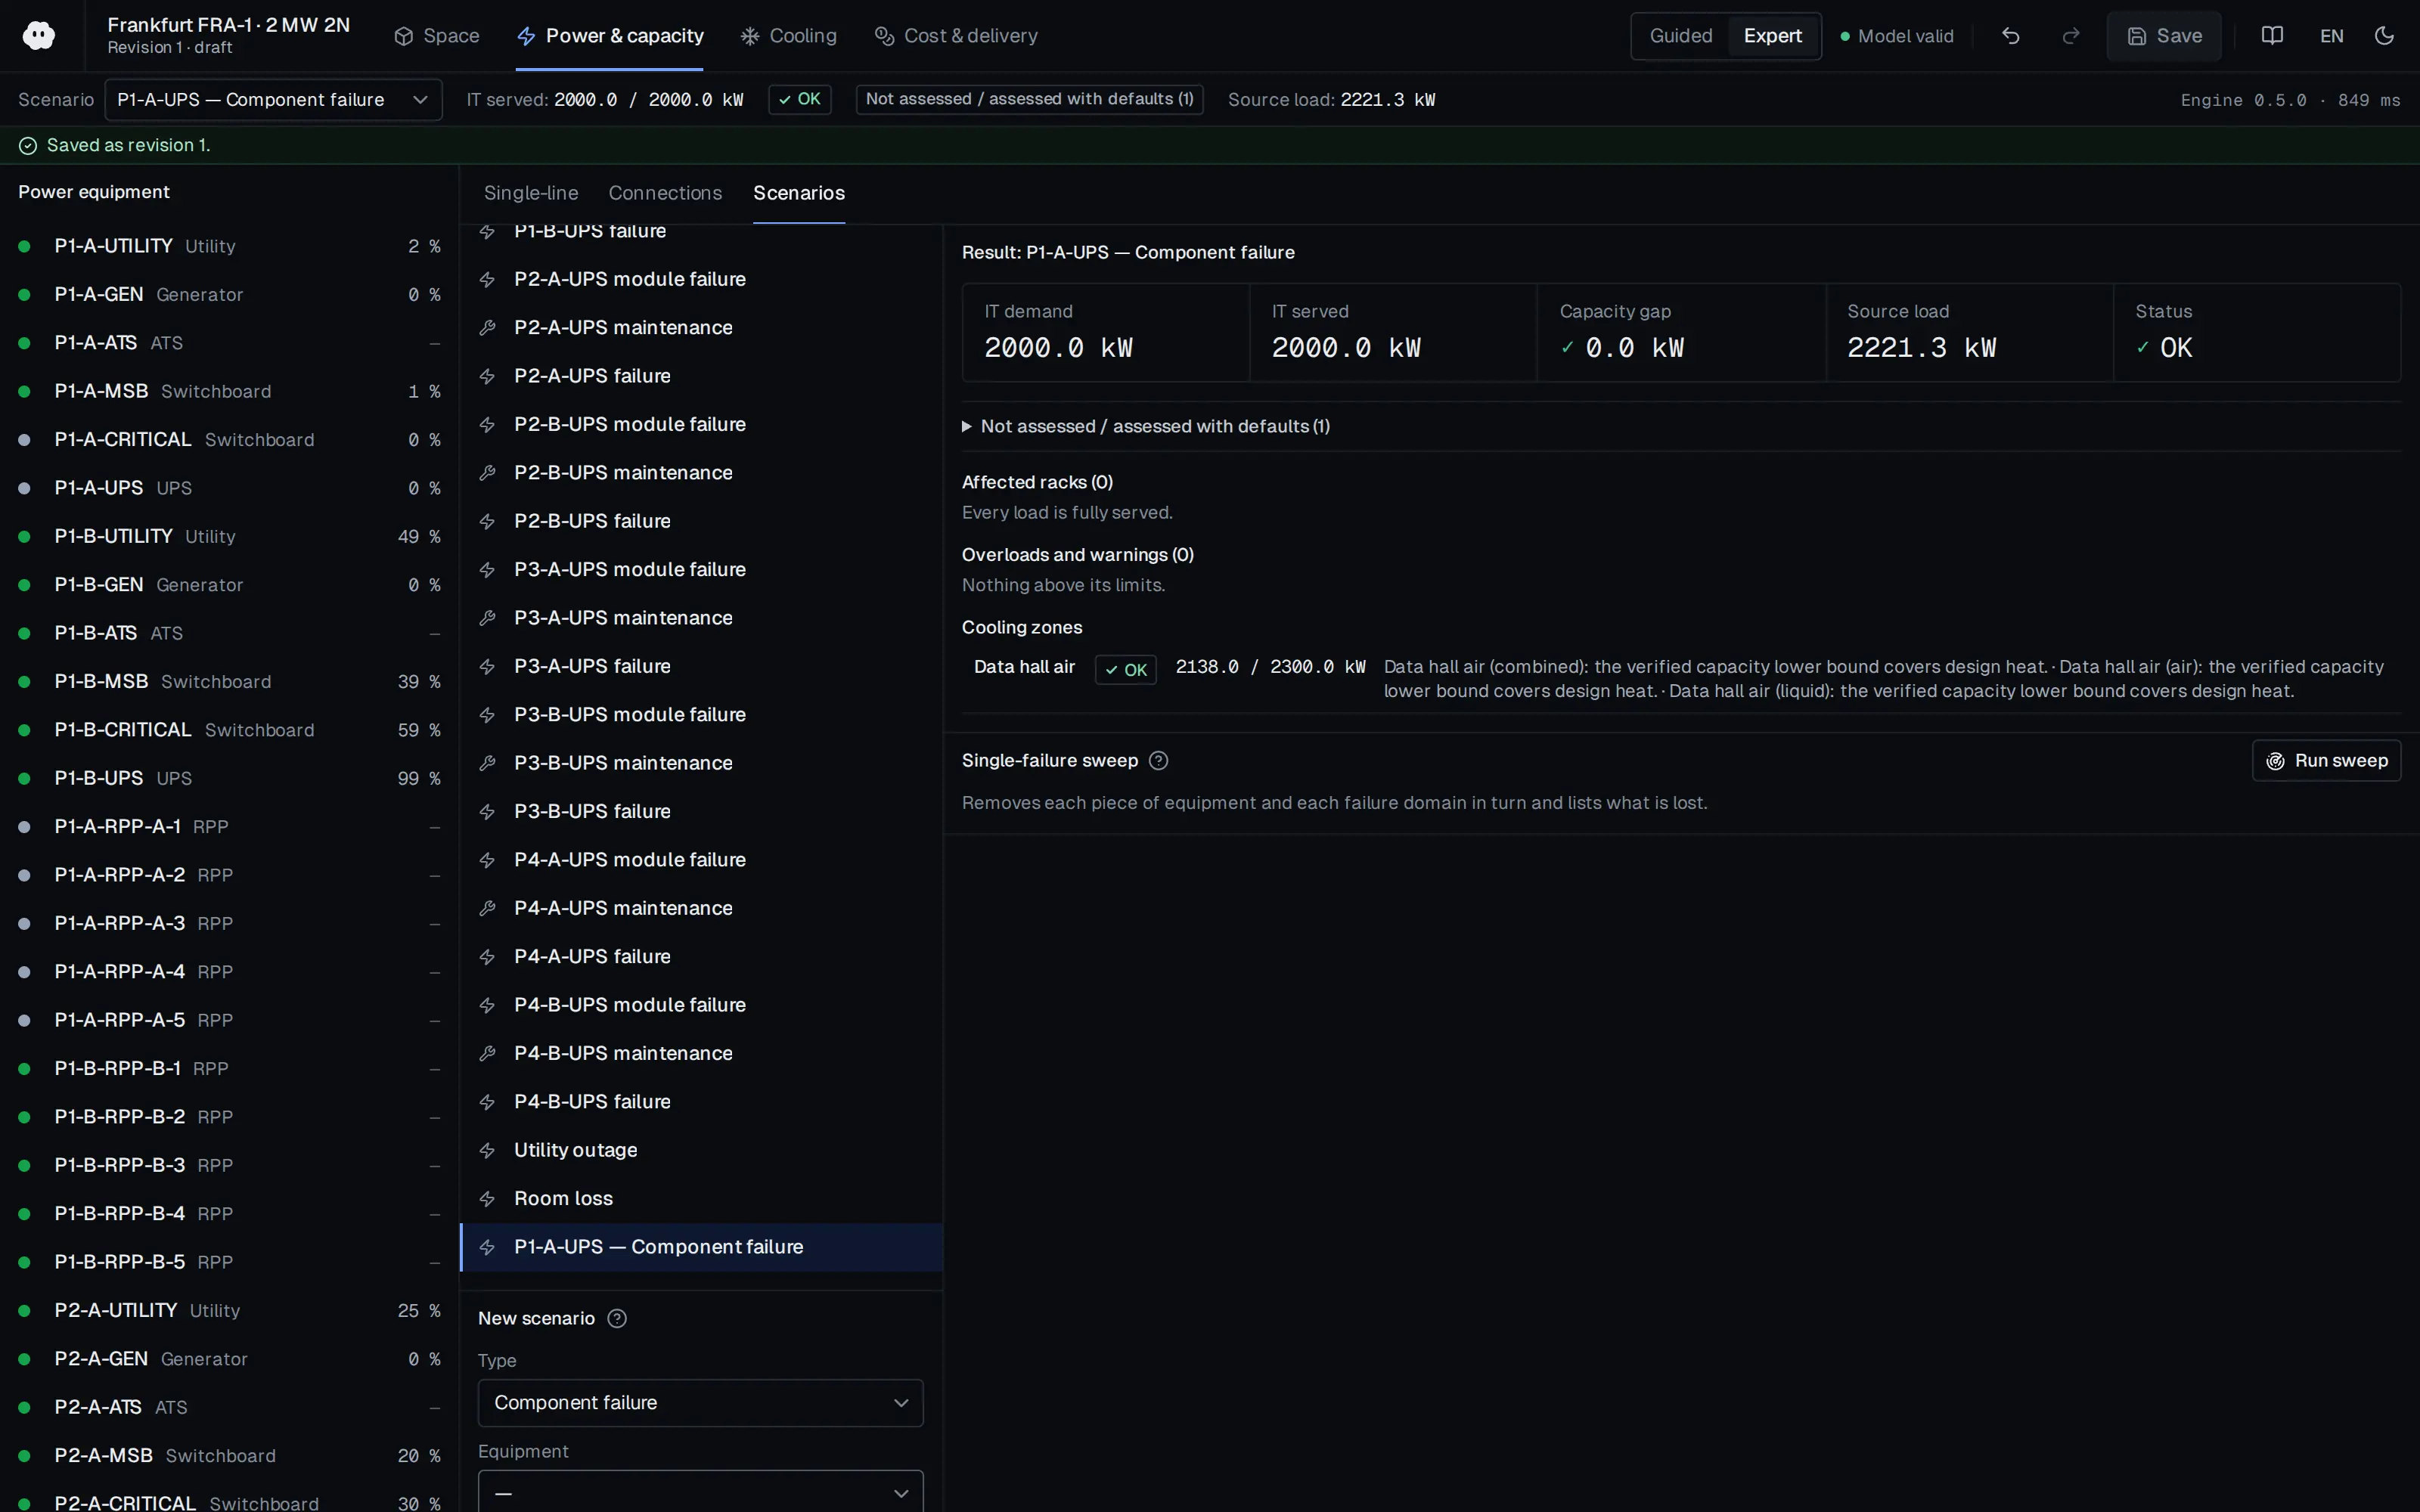
Who should read it
Energy and facility managers, maintenance engineers and operations teams who establish building O&M programmes, including for data centers.
Document contents
- Chapter 1 - Introduction and Overview
- Chapter 2 - Why O&M?
- Chapter 3 - O&M Management
- Chapter 4 - Computerized Maintenance Management System
- Chapter 5 - Types of Maintenance Programs
- Chapter 6 - Predictive Maintenance Technologies
- Chapter 7 - Commissioning Existing Buildings
- Chapter 8 - Metering for Operations and Maintenance
- Chapter 9 - O&M Ideas for Major Equipment Types
- Boilers and Steam Traps
- Chillers
- Cooling Towers
- Energy Management/Building Automation Systems and Air Handling Systems
- Fans, Pumps, Motors, Air Compressors and Lighting
- Chapter 10 - O&M Frontiers
- Chapter 11 - Ten Steps to Operational Efficiency
- Appendix A - Glossary of Common Terms
Read the document
femp-om-best-practices-guide.pdf
U.S. public domain — U.S. Government work; free to reuse
The document is provided unaltered because its licence permits redistribution.
Publication details
- Authors
- G. P. Sullivan; R. Pugh; A. P. Melendez; W. D. Hunt
- Publisher
- U.S. DOE FEMP
- Year
- 2010
- Document language
- English
- Source type
- Government / public
- Access
- Open licence — downloadable
- Licence
- U.S. public domain — U.S. Government work; free to reuse
- Licence evidence
- www.energy.gov
Original licence note
DOE/FEMP publication hosted on energy.gov; DOE web policy: "Government information at DOE websites is in the public domain" (acknowledge DOE). Authored by a national laboratory under contract for FEMP; third-party contributed images may still be copyrighted.
Citation
G. P. Sullivan; R. Pugh; A. P. Melendez; W. D. Hunt (2010). Operations & Maintenance Best Practices: A Guide to Achieving Operational Efficiency, Release 3.0 (August 2010). U.S. DOE FEMP. https://www.energy.gov/sites/prod/files/2020/04/f74/omguide_complete_w-eo-disclaimer.pdf
Events on this subject
Browse the events calendarAll content and rights belong to the respective authors and publishers. SoSo CAD provides only the citation, its own summary and a link to the source, and is not responsible for the sources' content.
Related sources
All sources on this topic
Buildings (MDPI AG) 2026
Load-Adaptive Operational Control of an Indirect Evaporative Cooling System for Coordinated Energy and Water Use in a Modular Data Center in a Cold Region
In IEC control, stage airflow to follow load rate and spray to follow room temperature, and prefer a low fresh/return air ratio.
- Going from load rate 0.7 to 1.0 raised annual electricity by 16.2% but water by 74.8% and WUE by 70.6%.
Beca 2026
Part 2: Designing next-generation data centres - Principals for efficiency and resilience
Let users set the cold-aisle supply temperature and recompute free-cooling hours from the site weather file.
- A PUE of about 1.4 is described as a common target; going lower needs more than conventional air cooling.
Huawei Digital Power 2024
Top 10 Trends of Data Center Facility 2024 White Paper
For lithium BESS/UPS rooms, require detection and segregation sized for a 30-60 s runaway escalation.
- Rack power expected to rise from 6-8 kW to 30-40 kW.
Huawei Digital Power 2023
White Paper on the Top 10 Trends of Data Center Facilities
Show WUE alongside PUE in the metrics panel, with region-specific targets as policy presets.
- At 16 kW per rack, power-room area roughly equals IT space (1:1).
U.S. DOE FEMP 2021
Sandia's Liquid-Cooled Data Center Boosts Efficiency and Resiliency (FEMP success story, DOE/GO-102021-5582, July 2021)
Consider negative-pressure (vacuum) distribution as an option for reducing leak risk in direct liquid cooling; flexible hoses give layout flexibility.
- The system kept CPUs below 50 °C (122 °F); each CDU draws 3.4 kW at full load, about 1.6% of total system power.
U.S. DOE Better Buildings / Lawrence Berkeley National Laboratory 2017
Data Center Metering and Resource Guide (February 2017)
At a stand-alone site, design meters that record energy (kWh) at the utility entrance and at the UPS output (or at panels serving only IT if there is no UPS); a UPS display that shows only power (kW) is not enough.
- PUE Level 1 for a stand-alone data center is utility meter reading divided by UPS output energy (M1/M2).