
Data Center Metering and Resource Guide (February 2017)
U.S. DOE Better Buildings / Lawrence Berkeley National Laboratory · Lawrence Berkeley National Laboratory, U.S. DOE Better Buildings
A practical guide written for DOE Better Buildings Challenge partners on metering data centers to measure PUE, focused on The Green Grid's PUE Level 1 (basic). It shows where meters go and how to estimate PUE from partial metering.
On this page
Overview
The guide was prepared by Lawrence Berkeley National Laboratory for the DOE Better Buildings programme. Its introduction notes that data centers use about 2% of U.S. electricity and that sector energy use grows about 1% per year. It explains why metering is needed for metrics: spotting abnormal use, tracking costs, benchmarking, validating strategies and finding faults in physical systems. Better Buildings partnership requires fully metered data; partial metering or estimates suit baseline data only. The guide focuses on embedded data centers with incomplete metering.
PUE is the ratio of total energy use to IT equipment energy. The Green Grid defines three levels. In Level 1, IT load is measured at the UPS output and transformer and distribution losses between the UPS and IT count as IT load. In Level 2, PDU losses count as infrastructure and most points are automatic with some recorded manually; UPS and PDU readings are typically accurate to a few percent and utility meters to within 1%. In Level 3 all points are automatically metered and derived metrics are precise. At a stand-alone data center, Level 1 PUE is the utility meter reading divided by UPS output energy (M1/M2). Basic monitoring collects energy measurements at least monthly.
For embedded centers the guide gives tables of PUE estimation methods. Assumptions: 10% electrical distribution loss downstream of the UPS (M2/0.9), an extra 3% for upstream losses when UPS input is metered, and 0.285 to convert kW of heat rejection to tons. For a chiller plant, Eff is chiller efficiency plus 0.2 kW/ton (pumps and tower fans), plus 0.1 for an air-cooled plant. Air-cooled CRAC efficiency including fans is taken as 1.45 kW/ton, and 0.25 kW/ton when a water-side economizer operates. CRAH fan energy is estimated as motor horsepower x 0.746 x 0.75 load factor x hours / motor efficiency. Lighting is usually under 1% and generator tests under 0.5%, so both can be ignored.
The guide lists ASHRAE 90.1-2010 minimum chiller IPLV values, such as 0.580 kW/ton for water-cooled positive-displacement chillers of 150-300 tons and 0.540 above 300 tons; these generally understate consumption of plants older than 2010. It covers planning, information gathering (single-line diagrams, mechanical diagrams, a site visit, since drawings are often inaccurate), implementation method (contracted, internal, hybrid) and commissioning steps. For commissioning it recommends an end-to-end check with a portable meter and comparing the sum of sub-meters with the main meter. Electrical meters need the system de-energised, so install one N+x system at a time or during planned maintenance; for thermal meters use hot-taps or ultrasonic meters.
On cost, metering runs about $150-$1,500 per point ($150-$400 wireless, $500-$1,500 wired), and a reliable permanent power meter costs $3,000-$10,000. PUE metering packages range from about $3,000 (integrating existing meters) to $17,000 (main meter, UPS communications and a BTU meter). The document stresses that estimated PUE is acceptable as a baseline but less accurate and hard to adjust after efficiency improvements, so additional metering is encouraged. It dates from 2017 and has a U.S. context; the table values are example estimation coefficients.
Key points
- PUE Level 1 for a stand-alone data center is utility meter reading divided by UPS output energy (M1/M2).
- Lighting is usually under 1% of total data center energy and generator testing (weekly no-load, quarterly full-load) under 0.5%, so both can be ignored in PUE estimates.
- PUE estimation assumes 10% electrical distribution loss downstream of the UPS (M2/0.9), adds 3% for losses upstream of the UPS input, and uses 0.285 to convert kW of heat rejection to tons.
- For a chilled water plant, Eff = chiller efficiency + 0.2 kW/ton to cover pumps and tower fans; CRAH fan energy is estimated as hp x 0.746 kW/hp x 0.75 load factor x hours / motor efficiency.
- Typical air-cooled CRAC efficiency including fans is taken as 1.45 kW/ton; cooling during water-side economizer operation is taken as 0.25 kW/ton.
- Metering costs about $150-$1,500 per point (wireless $150-$400, wired $500-$1,500); a reliable permanent power meter costs $3,000-$10,000.
- PUE metering packages range from about $3,000 (integrating existing meters) to $17,000 (main meter, UPS communications and a BTU meter).
- ENERGY STAR IT equipment reports input power within ±5% and samples power, inlet temperature and CPU utilization at least every 10 seconds.
- In Level 1 the IT load is measured at the UPS output, and transformer and distribution losses between UPS and IT count as IT load; UPS and PDU readings are accurate to a few percent, utility meters to within 1%.
- ASHRAE 90.1-2010 minimum chiller IPLV values include 0.580 kW/ton for water-cooled positive-displacement chillers of 150-300 tons and 0.540 above 300 tons; older plants typically use more.
Using it in design
- At a stand-alone site, design meters that record energy (kWh) at the utility entrance and at the UPS output (or at panels serving only IT if there is no UPS); a UPS display that shows only power (kW) is not enough.
- For embedded centers on a shared chilled water plant, determine from the mechanical diagrams where thermal (BTU) meters go on the chilled water lines to the data center, and meter the chiller plant electrical input if possible.
- Use estimated PUE only as a baseline; check the coefficients (10% distribution loss, 0.285 conversion, chiller efficiency + 0.2 kW/ton) against your own design assumptions and budget for additional metering from the start.
- Plan meter installation knowing that panels cannot be metered while energised: do it one N+x system at a time or during planned maintenance, and use hot-tap ports or ultrasonic meters for thermal metering.
- Add to commissioning an end-to-end check (portable meter against the display), a test of energy accumulation (kW to kWh) and a sum check of sub-meters.
- Pre-estimate the metering budget from the per-point unit cost ($150-$1,500) and the PUE package range ($3,000-$17,000).
Monthly newsletter · free
Keep your reading list current
Once a month: new library sources, changes to Turkish regulations and upcoming data centre events.
SoSo CAD
Compare the cost of design decisions
Evaluate equipment costs, energy expenses and total cost of ownership (TCO) using your inputs and assumptions in SoSo CAD.
Request a demo
Who should read it
Electrical and mechanical designers, facility and energy managers who design data center metering and monitoring, calculate PUE or establish a baseline.
Document contents
- Introduction
- Definitions: PUE as a Metric
- Levels of PUE (1 through 3) per The Green Grid
- Metering Implementation: Data Center Type
- Energy vs. Power
- PUE Estimation (Table 1, Table 2, Chiller Efficiency Table 3)
- Planning
- Collection of Information to Determine System Type
- Determination of Implementation Method (Contracted, Internal, Hybrid)
- Commissioning: End-to-End Check and Sum Checking
- Anticipated Scenarios: Stand-alone and Embedded Data Centers
- Metering Method Options: Leveraging Existing Meters and Starting Without Meters
- Meter Types and Their Uses
- Challenges to Meter Installation and Possible Solutions
- Multiple Metering Systems
- Metering Costs
- Appendix A: Data Center Energy Practitioner (DCEP) Program
- Appendix B: Data Center Profiler (DC Pro) Tools
Publication details
- Authors
- Lawrence Berkeley National Laboratory; U.S. DOE Better Buildings
- Publisher
- U.S. DOE Better Buildings / Lawrence Berkeley National Laboratory
- Year
- 2017
- Document language
- English
- Source type
- Government / public
- Access
- Citation only
- Licence
- Licence conditions not established — confirm the conditions with the publisher
- Licence evidence
- datacenters.lbl.gov
Original licence note
LBNL guide prepared for FEMP; no license statement; contractor work, not automatically public domain.
Citation
Lawrence Berkeley National Laboratory; U.S. DOE Better Buildings (2017). Data Center Metering and Resource Guide (February 2017). U.S. DOE Better Buildings / Lawrence Berkeley National Laboratory. https://datacenters.lbl.gov/sites/default/files/DataCenterMeteringandResourceGuide_02072017.pdf
Events on this subject
Browse the events calendarAll content and rights belong to the respective authors and publishers. SoSo CAD provides only the citation, its own summary and a link to the source, and is not responsible for the sources' content.
Related sources
All sources on this topic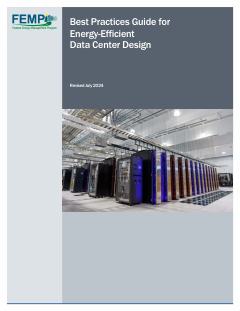
U.S. DOE FEMP / NREL 2024
Best Practices Guide for Energy-Efficient Data Center Design (Revised July 2024)
Weigh the supply air setpoint against server fan energy: raise it in small steps within the ASHRAE recommended range so the most demanding inlet nears 80 °F, only after air management is in place, and control to IT inlet temperature rather than return temperature.
- Compute racks reached 60 kW in 2013, and recent liquid-cooled racks exceed 125 kW.
International Energy Agency 2025
Energy and AI (World Energy Outlook Special Report)
Use the IEA component split (servers about 60%, storage about 5%, network up to 5%, cooling 7-30%) to sanity-check modelled energy breakdowns.
- The 2035 range across cases is 700-1,700 TWh; the High Efficiency Case is 20% below the Base Case.
TÜV NORD 2026
EN 50600 — data centre facilities and infrastructures (overview and certification)
In an 'EN 50600' standards profile, offer separate availability-class selectors for power, cooling and cabling (instead of a single Tier), plus a protection-class selector per room or zone
- Protection classes 1-4 for unauthorised access and other hazards; physical-security zoning required
Socomec 2024
Data centre - How to ensure power availability, electrical safety and energy performance? (Expert advice & innovative solutions guide)
In the single-line editor, tag transfer devices as ATSE (IEC 60947-6-1) or STS with a transfer-time field, and suggest STS where the load needs under about 10 ms.
- Human error accounts for 22 % of unplanned outages.
ASHRAE 2023
Using Network Modeling to Test for ASHRAE 90.4 Standard Compliance (2023 ASHRAE Winter Conference paper)
The tool can compute 90.4 MLC and ELC directly from its mechanical and electrical one-lines: segment losses, UPS efficiency at 100/50/25% load and hourly weather by climate zone.
- The authors argue that standardised tools would encourage states to adopt 90.4.
Huawei Digital Power 2023
White Paper on the Top 10 Trends of Data Center Facilities
Show WUE alongside PUE in the metrics panel, with region-specific targets as policy presets.
- At 16 kW per rack, power-room area roughly equals IT space (1:1).