
Data centre water consumption
npj Clean Water (Springer Science and Business Media LLC) · David Mytton
A perspective that reviews how data centres consume water: directly through evaporative and cooling-tower heat rejection and indirectly through electricity generation, and how the sector measures and reports this use.
CC BY 4.0 — share with attribution
On this page
Overview
The ICT sector will grow, with 29.3 billion devices expected online by 2030, up from 18.4 billion in 2018. Data-centre energy consumption regularly receives coverage, but analysis of water consumption is scarce. The paper examines how data centres consume water directly for cooling, in some cases 57% sourced from potable water, and indirectly through the water requirements of non-renewable electricity generation. In the USA, data-centre water consumption is about 1.7 billion litres/day, against total US consumption of 1218 billion litres/day.
Context figures: the US average water intensity of electricity generation in 2015 was 2.18 L/kWh; consumption for hydropower is 16.8 L/kWh, compared with 1.25 L/kWh for thermoelectricity. Digital Realty sourced 64% (2017), 65% (2018) and 57% (2019) of its water from potable supplies. A small 1 MW data centre using traditional evaporative or cooling-tower cooling can use around 25.5 million litres of water per year. Raising chilled-water temperature from the usual 7-10 °C to 18-20 °C can cut expenses by 40%.
WUEsource adds annual source-energy water use to annual site water use and divides by ICT equipment energy; the author recommends that cloud vendors calculate and publish it alongside PUE. Less than a third of data-centre operators track any water metrics, and water conservation is ranked as a low priority. Electricity generation is the largest contributor to a data centre's water footprint but is invisible without metrics like WUEsource. Moving to the cloud is more efficient, but transparency is a major issue: Microsoft and Google produce detailed but aggregate environmental reports, and Amazon publishes almost nothing.
Limits: a perspective with no new measurements; values are collected from published company reports and generic grid water intensities. Industry directions listed include free cooling, higher chilled-water temperatures, recycled water, liquid cooling and siting.
Key points
- US data-centre water consumption is about 1.7 billion litres/day, compared with total US consumption of 1218 billion litres/day.
- The US average water intensity of electricity generation in 2015 was 2.18 L/kWh; consumption for hydropower is 16.8 L/kWh, compared with 1.25 L/kWh for thermoelectricity.
- Digital Realty sourced 64% (2017), 65% (2018) and 57% (2019) of its water from potable supplies.
- A small 1 MW data centre using traditional evaporative or cooling-tower cooling can use around 25.5 million litres of water per year.
- Raising chilled-water temperature from the usual 7-10 °C to 18-20 °C can cut expenses by 40%.
- Less than a third of data-centre operators track any water metrics, and water conservation is ranked as a low priority.
- WUEsource adds annual source-energy water use to annual site water use and divides by ICT equipment energy; the author recommends cloud vendors publish it alongside PUE.
Using it in design
- In cooling selection, add the roughly 25.5 million litres per year per MW of evaporative cooling water need and the potable share (57-65%) to the siting and water supply decision.
- Evaluate raising chilled-water temperature from 7-10 °C to 18-20 °C and free cooling as both energy and water reduction options (expenses can fall 40%).
- Report WUE and WUEsource (including indirect water from electricity) alongside PUE.
Monthly newsletter · free
Keep your reading list current
Once a month: new library sources, changes to Turkish regulations and upcoming data centre events.
SoSo CAD
Check cooling capacity alongside your design
Review zone heat loads, available capacity and the capacity balance after the largest unit is lost in SoSo CAD.
Request a demo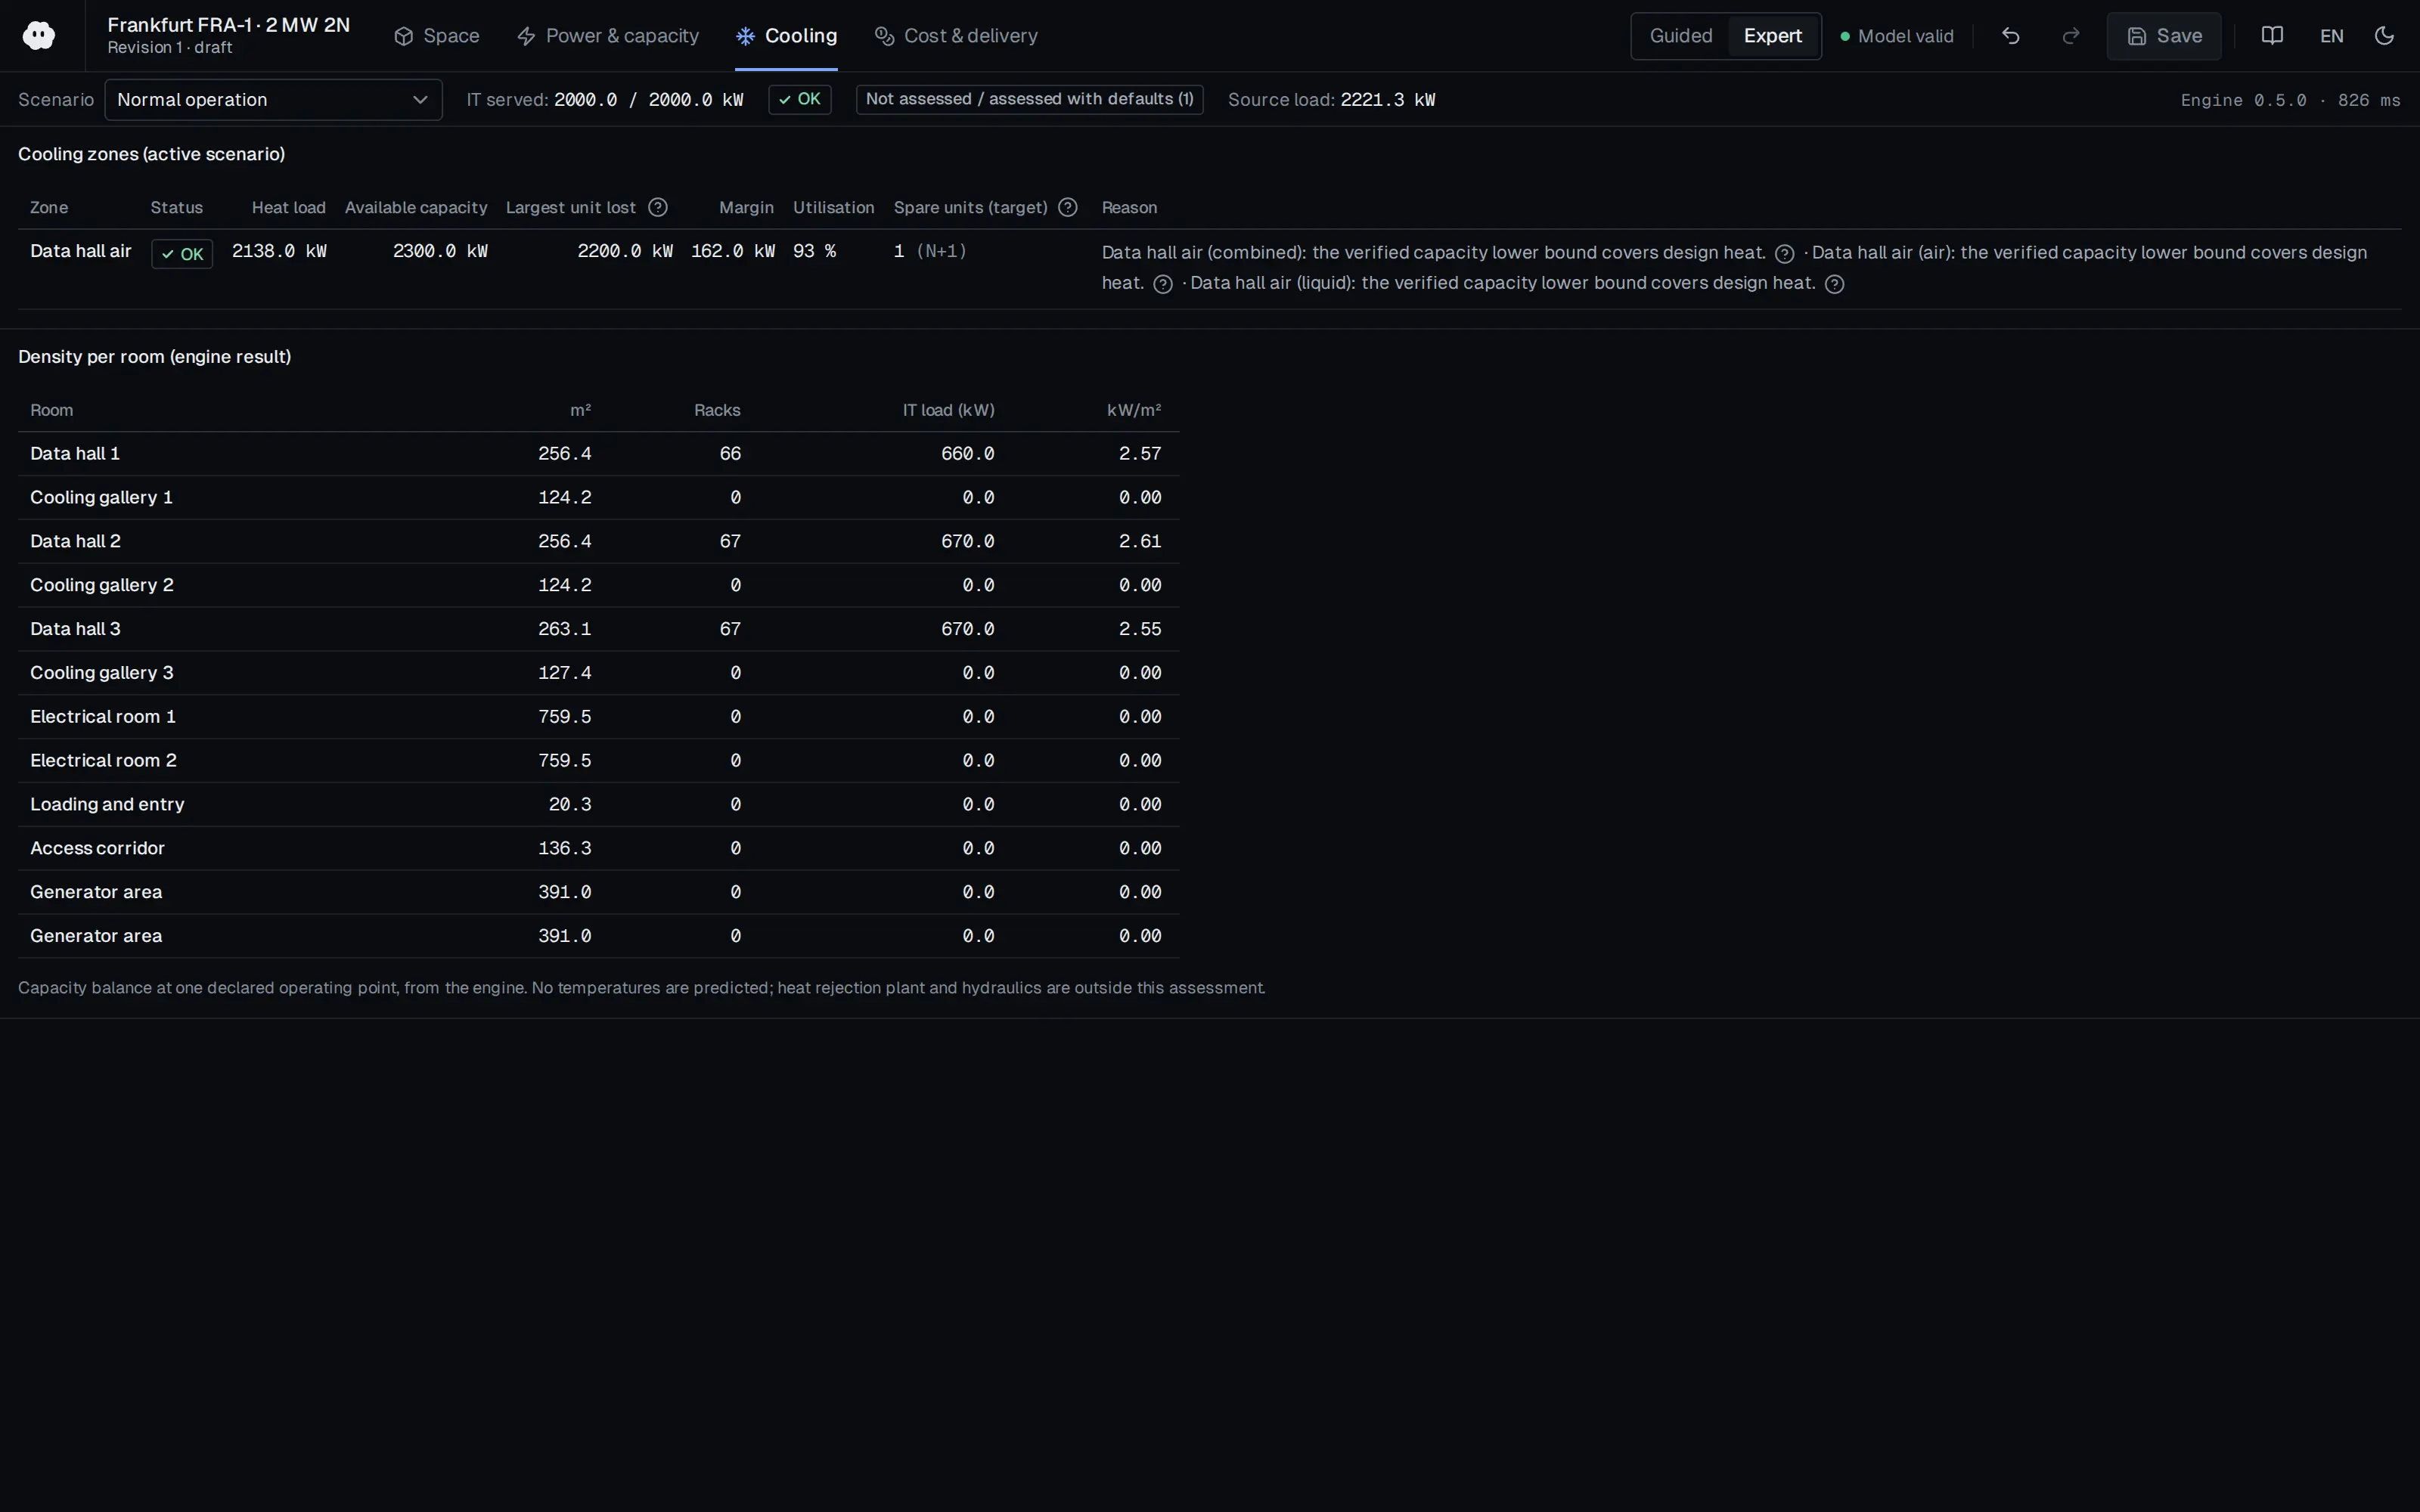
Who should read it
Designers and sustainability managers evaluating data-centre water use, reporting and cooling selection.
Document contents
- Introduction
- Direct and indirect water use in data centres
- Measuring and reporting water consumption: WUE and WUEsource
- Published hyperscaler figures and grid water intensities
- Industry directions: free cooling, higher chilled-water temperatures, recycled water, liquid cooling and siting
- Conclusions
Related standards
- The Green Grid WP35 (WUE)
- ISO/IEC 30134-9
Read the document
mytton-data-centre-water-consumption-2021.pdf
CC BY 4.0 — share with attribution
The document is provided unaltered because its licence permits redistribution.
Publication details
- Authors
- David Mytton
- Publisher
- npj Clean Water (Springer Science and Business Media LLC)
- Year
- 2021
- Volume
- 4
- Issue
- 1
- Pages
- 11
- Document language
- English
- Source type
- Scientific
- Access
- Open licence — downloadable
- Licence
- CC BY 4.0 — share with attribution
- Licence evidence
- www.nature.com
Original licence note
The article is marked OPEN and published under a Creative Commons Attribution 4.0 International License (see the licence statement at the end of the article).
Citation
David Mytton (2021). Data centre water consumption. npj Clean Water (Springer Science and Business Media LLC). 4(1), 11. https://doi.org/10.1038/s41545-021-00101-w
Events on this subject
Browse the events calendarAll content and rights belong to the respective authors and publishers. SoSo CAD provides only the citation, its own summary and a link to the source, and is not responsible for the sources' content.
Related sources
All sources on this topic
Fluids (MDPI AG) 2026
A Review of Thermal Management in Modern Data Centres: Water Usage Effectiveness and Heat Transfer Coefficients
Set WUE targets from the heat-rejection topology (dry, free-cooling, hybrid, evaporative) and not only the server-side cooling technology; WUE depends on the share of heat rejected by evaporation.
- Dry facilities with closed-loop liquid cooling need essentially no water, while evaporative systems typically report WUE up to 2.5 L/kWh.
Resources, Conservation and Recycling (Elsevier BV) 2022
Climate- and technology-specific PUE and WUE estimations for U.S. data centers using a hybrid statistical and thermodynamics-based approach
In early data-centre design, set PUE and WUE targets by size class, cooling system and climate zone using this study's ranges (for example 1.71-2.22 for small rooms, 1.12-1.25 for large scale).
- Airside economisers with adiabatic cooling (case 1) use less water than airside economisers alone (case 3).
Schneider Electric 2026
Water Usage at AI Scale: Insights from a 100 MW Comparative Analysis
Compute and display WUE (L/kWh IT) next to PUE for every cooling design.
- Dallas WUE falls from 0.42 to 0.22 L/kWh; Paris from 0.12 to 0.06 L/kWh.
Burns & McDonnell 2024
Fluid Dynamics: Liquid Cooling's Role in the Future of Data Centers
For liquid-cooled racks, always keep a residual air-cooling load (default 20-50% of IT, user-adjustable) and size CRAH or fan-wall capacity for it.
- Some solutions reach 80-120+ kW per rack versus a typical 8-12 kW.
Cundall 2024
Is power or water best for cooling?
When a user selects a cooling topology, show a three-way comparison of energy (PUE), water (WUE) and carbon (CUE using local grid intensity) for the chosen site.
- Danish hyperscale project with Fjernvarme Fyn: heat pumps lift to 70-75 C, expected 165,000 MWh/yr of heat at full build-out.
Lawrence Berkeley National Laboratory 2024
2024 United States Data Center Energy Usage Report (LBNL-2001637, December 2024)
Take AI rack and node power assumptions (3.4 to 12.2 kW per 8-GPU server, 20% idle) as a cross-check on IT load models, not as a substitute for vendor data.
- U.S. data centers used about 76 TWh (1.9% of U.S. electricity) in 2018 and 176 TWh (4.4%) in 2023.