
Water Usage at AI Scale: Insights from a 100 MW Comparative Analysis
Schneider Electric · Fabian Janischowsky, Amir Ibraheem et al.
Schneider Electric WP 220 treats data center water consumption as a design choice rather than a fixed consequence of size or climate. It simulates four 100 MW designs in Dallas and Paris to show how WUE collapses as TCS temperature rises.
On this page
Overview
The study compares four designs: a traditional air-cooled site, an AI factory with liquid cooling at 32 C TCS, the same factory at 45 C TCS, and a 45 C version with right-sized equipment. Each is simulated in Dallas and Paris. The scenario basis is 188 kW liquid-cooled server racks, 86.6 MW of liquid plus 13.4 MW of air-cooled load, and networking racks of 20/40 kW cooled by air.
The effect of each step is given separately. Moving from air to liquid (32 C TCS) lowers on-site water about 8% in Dallas, and PUE about 7% (cooling overhead about 63% lower). Raising TCS from 32 C to 45 C cuts WUE 66 to 82% depending on location while improving PUE only about 0.6%. Example values: Dallas 0.42 to 0.22 L/kWh, Paris 0.12 to 0.06 L/kWh. Right-sizing the equipment for 45 C reduces WUE about 50% against the 32 C baseline.
The paper also supplies typical WUE ranges: about 1.7 to 4 L/kWh with cooling towers and about 0.2 to 1.5 L/kWh with adiabatic dry coolers. It shows adiabatic assist is poor value at high TCS temperature: in Paris it improved PUE by only about 0.13% while raising water use from 0 to 0.07 L/kWh. The conclusion is that water use is not a fixed price; cooling architecture and liquid temperature can shift it by 66 to 82%. The limit is that only two climates and four schemes are modelled, so other climates need their own calculation.
Key points
- Typical WUE is about 1.7 to 4 L/kWh with cooling towers and about 0.2 to 1.5 L/kWh with adiabatic dry coolers.
- Air to liquid (32 C TCS): on-site water about 8% lower in Dallas; PUE about 7% lower (cooling overhead about 63% lower).
- TCS 32 to 45 C: WUE down 66 to 82%, PUE down about 0.6% (cooling overhead about 13%).
- Right-sizing for 45 C: WUE down about 50% and PUE about 0.5% versus the 32 C baseline.
- Dallas WUE falls from 0.42 to 0.22 L/kWh; Paris from 0.12 to 0.06 L/kWh.
- In Paris at high TCS, adiabatic assist cut PUE only about 0.13% but raised water from 0 to 0.07 L/kWh.
- Scenario basis: 188 kW liquid-cooled racks; 86.6 MW liquid plus 13.4 MW air-cooled load.
Using it in design
- Compute and display WUE (L/kWh IT) next to PUE for every cooling design.
- Use default WUE ranges: tower 1.7 to 4, adiabatic dry cooler 0.2 to 1.5, dry cooler without adiabatic 0.
- When TCS is 40 C or higher, recommend switching off adiabatic assist and show the water-versus-energy delta.
- For AI factories default the heat split to about 87% liquid / 13% air; add a water-stressed-site flag that steers toward high-temperature liquid with dry coolers.
Monthly newsletter · free
Keep your reading list current
Once a month: new library sources, changes to Turkish regulations and upcoming data centre events.
SoSo CAD
Check cooling capacity alongside your design
Review zone heat loads, available capacity and the capacity balance after the largest unit is lost in SoSo CAD.
Request a demo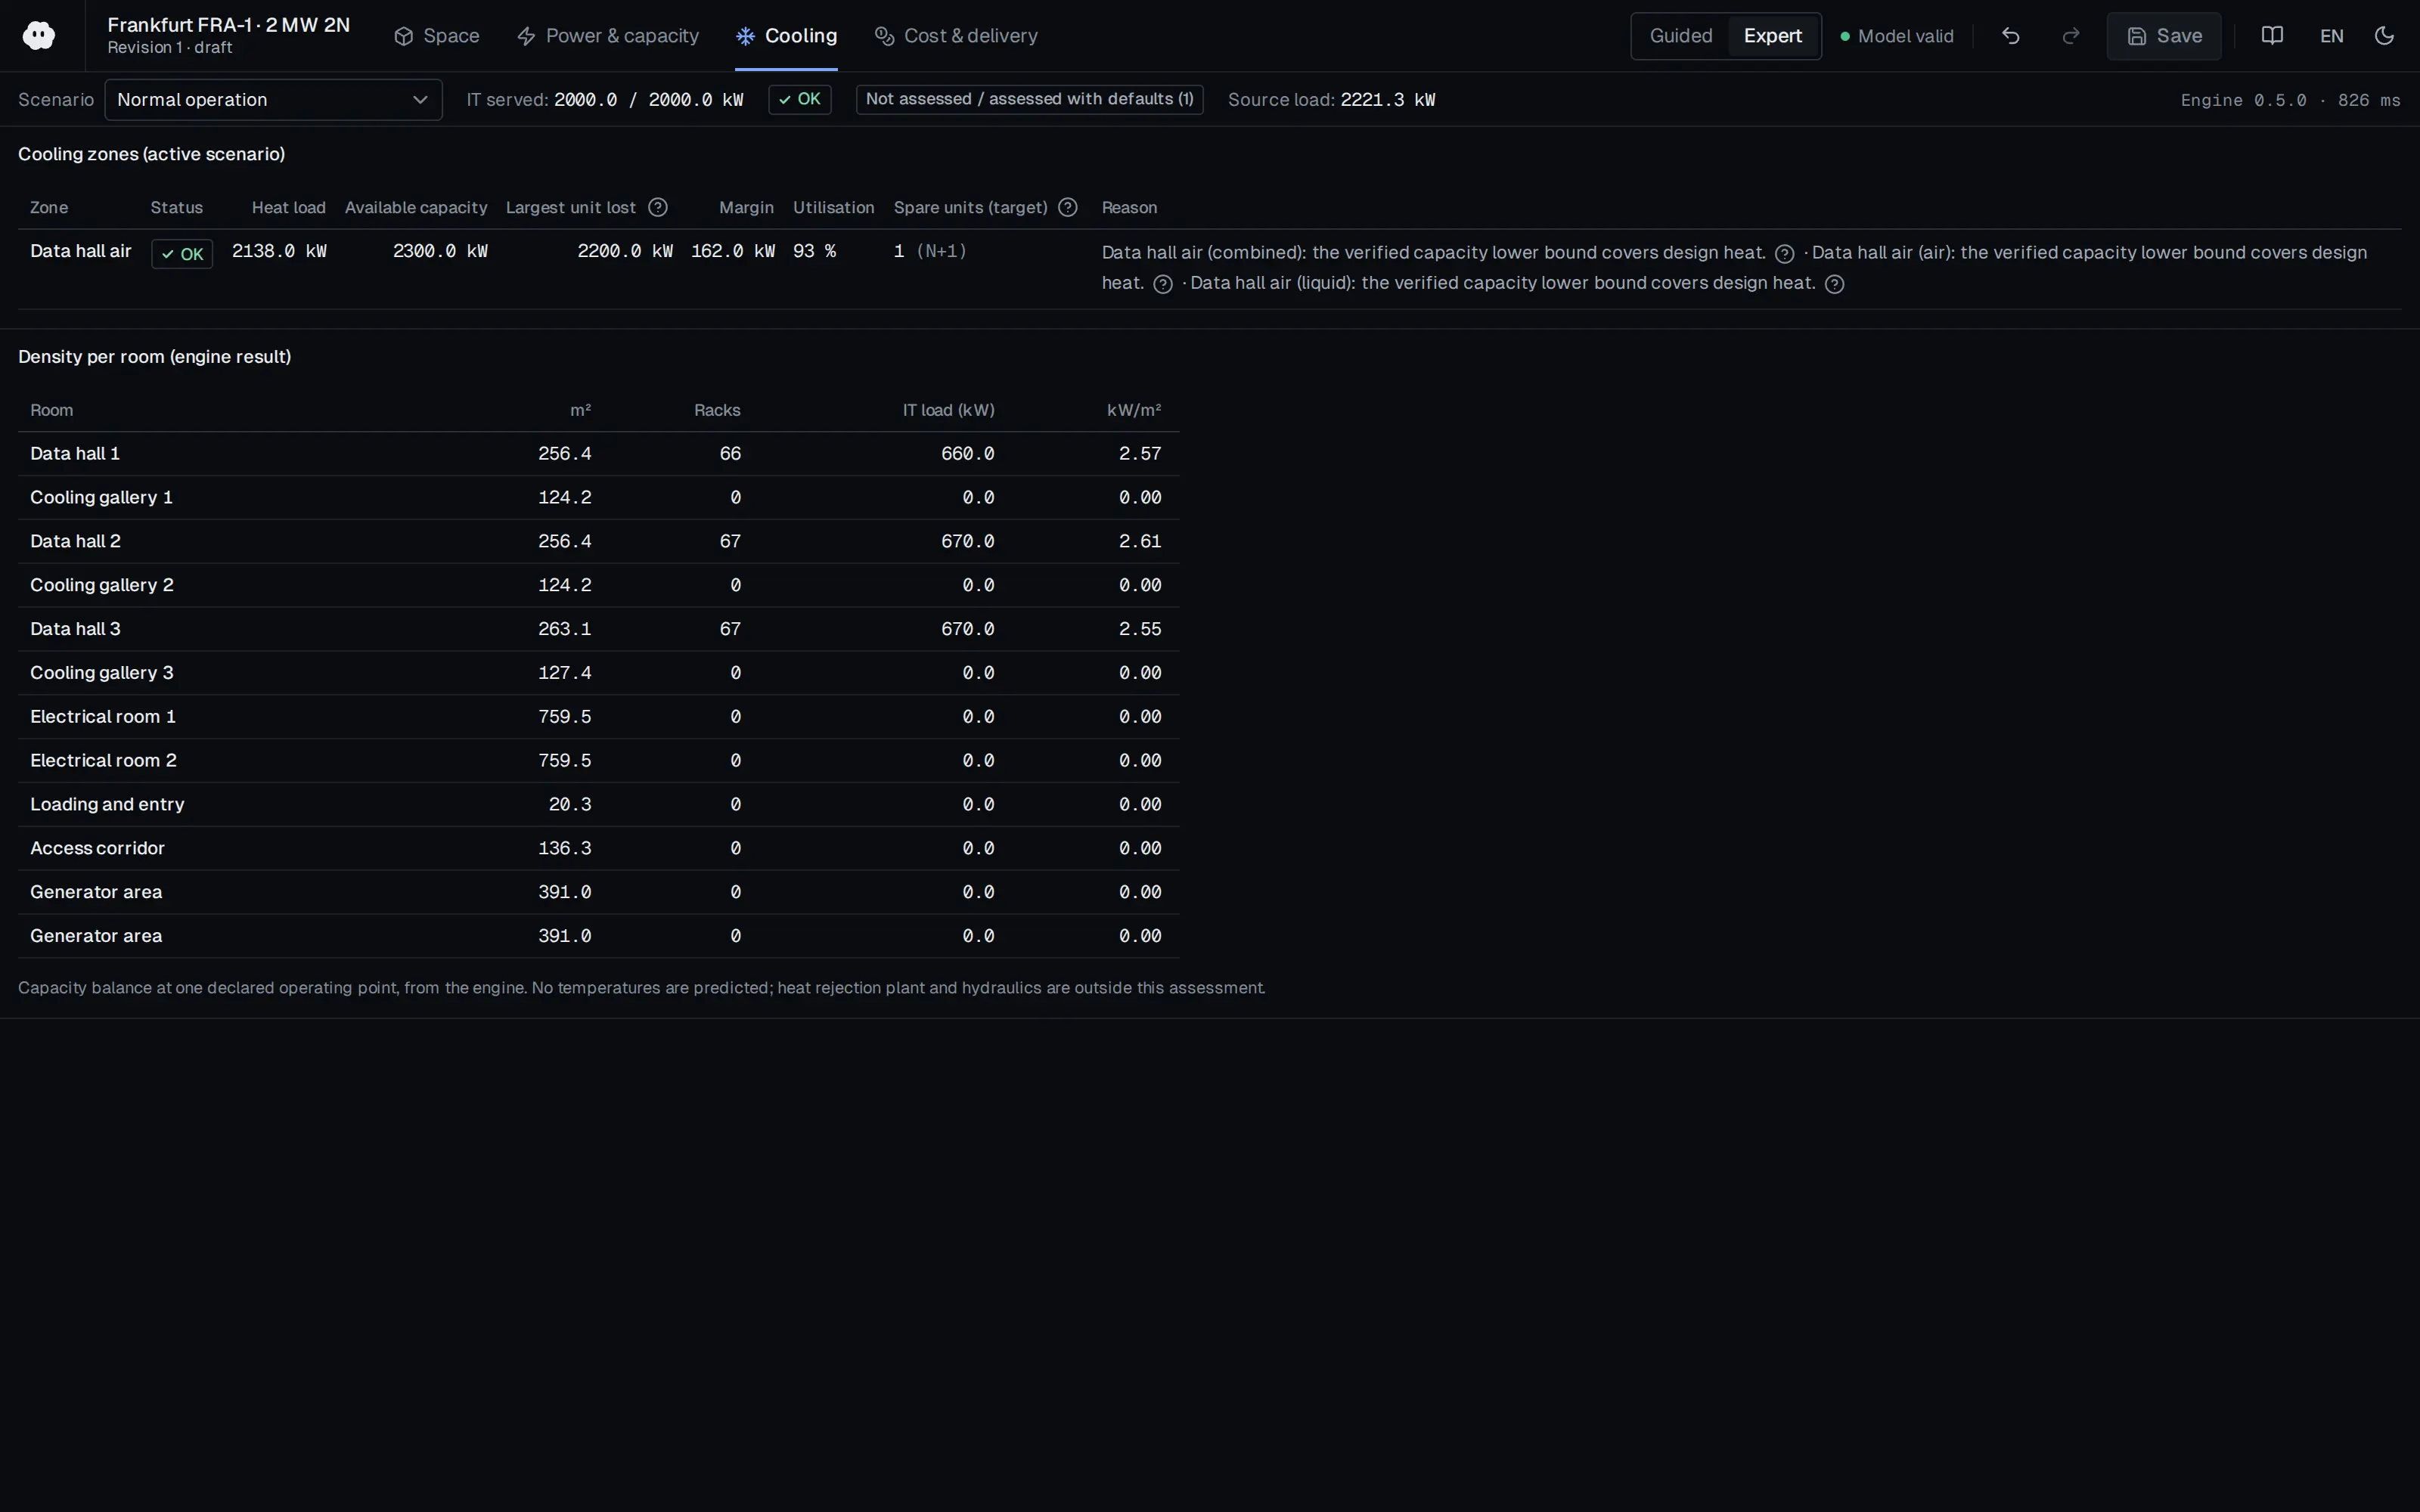
Who should read it
Designers planning AI campuses in water-constrained regions, and decision makers who must commit to a WUE target.
Related standards
- ISO/IEC 30134-9 (WUE)
- The Green Grid WUE
- ASHRAE TC9.9 Liquid Cooling Guidelines
Publication details
- Authors
- Fabian Janischowsky; Amir Ibraheem; Maria A. Torres Arango
- Publisher
- Schneider Electric
- Year
- 2026
- Document number
- WP 220
- Document language
- English
- Source type
- Manufacturer
- Access
- Free to read
- Licence
- Copyright retained; citation only — the publisher’s terms apply to the original document
Citation
Fabian Janischowsky; Amir Ibraheem; Maria A. Torres Arango (2026). Water Usage at AI Scale: Insights from a 100 MW Comparative Analysis. Schneider Electric. WP 220. https://download.schneider-electric.com/files?p_Doc_Ref=SPD_WP220_EN
Events on this subject
Browse the events calendarAll content and rights belong to the respective authors and publishers. SoSo CAD provides only the citation, its own summary and a link to the source, and is not responsible for the sources' content.
Related sources
All sources on this topicHuawei Digital Power 2023
White Paper on the Top 10 Trends of Data Center Facilities
Show WUE alongside PUE in the metrics panel, with region-specific targets as policy presets.
- At 16 kW per rack, power-room area roughly equals IT space (1:1).
NREL 2018
Thermosyphon Cooler Hybrid System for Water Savings in an Energy-Efficient HPC Data Center: Results (NREL/TP-2C00-72196, September 2018)
Check whether the warm return water from liquid cooling (here 84 °F after energy recovery) leaves enough temperature difference to ambient for a dry or hybrid stage, and size it against local dry-bulb hours.
- First-year heat rejection: 10.5% building heat reuse, 42.5% thermosyphon and 47% cooling towers.
Schneider Electric 2025
10 Data Center Sustainability Improvements Quantified by Environmental Impact
In the sustainability panel compute operational CO2e = IT MWh x PUE x grid EF, with a grid-EF catalog by country/region (default US 454 kg CO2e/MWh incl. upstream) and a renewable-PPA toggle.
- Total GHG falls from 84,100 to 11,300 t CO2e (-87%).
Fluids (MDPI AG) 2026
A Review of Thermal Management in Modern Data Centres: Water Usage Effectiveness and Heat Transfer Coefficients
Set WUE targets from the heat-rejection topology (dry, free-cooling, hybrid, evaporative) and not only the server-side cooling technology; WUE depends on the share of heat rejected by evaporation.
- Dry facilities with closed-loop liquid cooling need essentially no water, while evaporative systems typically report WUE up to 2.5 L/kWh.
U.S. DOE FEMP / NREL 2019
Using Thermosyphon Hybrid Cooling System to Optimize Data Center Water Efficiency (DOE/GO-102019-5172, May 2019)
Arrange the heat-rejection hierarchy as in the scheme: heat reuse first, then dry cooling, evaporative towers last; write the control logic in that order.
- Installing the TSC required only a 1-day data center outage.
Burns & McDonnell 2024
Fluid Dynamics: Liquid Cooling's Role in the Future of Data Centers
For liquid-cooled racks, always keep a residual air-cooling load (default 20-50% of IT, user-adjustable) and size CRAH or fan-wall capacity for it.
- Some solutions reach 80-120+ kW per rack versus a typical 8-12 kW.