
Comparing Performance Metrics of Partial Aisle Containments in Hard Floor and Raised Floor Data Centers Using CFD
Energies (MDPI AG) · Emelie Wibron, Anna-Lena Ljung et al.
An ANSYS CFX study of a small, reconfigurable test server room at RISE SICS North in Luleå, modelled as hard floor or raised floor, comparing side (end-of-row) and top cover partial containment at 100% and 50% of operating supply flow using RCI, RTI and Capture Index.
CC BY 4.0 — share with attribution
On this page
Overview
The study numerically investigates the effect of partial aisle containment between server racks in hard-floor and raised-floor configurations. The room measures 6.484 × 7.000 × 3.150 m with a switchable hard-floor or raised-floor setup; perforated tiles had 56% and 77% open area and were modelled as fully open because open area was at least 50%; supply temperature was 18.3 °C. Validation used velocity profiles at heights of 0.6, 1.0, 1.4, 1.8 and 2.2 m at five locations in both open-aisle configurations, with discretisation error estimated with the GCI on three tetrahedral grids. The Reynolds stress model was used instead of k-epsilon because k-epsilon is less accurate in low-velocity regions.
At operating supply flow, RCI was 100% for both floor types while RTI was only about 40% (hard floor) and 50% (raised floor), meaning the room was well cooled but energy-inefficient because of oversupply. With supply cut by 50%, RTI rose above 80%, and recirculation appeared in all containment variants while RCI still looked acceptable.
At 50% flow, the Capture Index of end rack R1 was 44.66% on the open hard floor versus 86% on the open raised floor (96.88% with a raised floor and side cover), showing local problems that averaged metrics hide. The authors argue for combining temperature-based and airflow-based metrics. Airflow management improved in the raised-floor configurations, where a top or side cover fully prevented recirculation.
Limits: a small test room with uneven rack load; results depend on this room geometry, and only two supply flow rates (100% and 50%) were examined.
Key points
- The room measures 6.484 × 7.000 × 3.150 m with a switchable hard-floor or raised-floor setup; perforated tiles had 56% and 77% open area (modelled as fully open since at least 50%); supply temperature was 18.3 °C.
- Validation used velocity profiles at heights of 0.6, 1.0, 1.4, 1.8 and 2.2 m at five locations in both open-aisle configurations; discretisation error was estimated with the GCI on three tetrahedral grids.
- The Reynolds stress model was used instead of k-epsilon because k-epsilon is less accurate in low-velocity regions.
- At operating supply flow, RCI was 100% for both floor types while RTI was only about 40% (hard floor) and 50% (raised floor): well cooled but energy-inefficient because of oversupply.
- With supply cut by 50%, RTI rose above 80%, and recirculation appeared in all containment variants while RCI still looked acceptable.
- At 50% flow, the Capture Index of end rack R1 was 44.66% on the open hard floor versus 86% on the open raised floor (96.88% with a raised floor and side cover).
Using it in design
- In airflow assessment do not rely on RCI alone; RCI of 100% coexisted with RTI of 40-50%, showing oversupply and bypass. Report RTI and per-rack Capture Index together.
- When reducing supply flow (50%), recognise that recirculation can appear and averaged metrics can hide it; check per-rack CI for end racks.
- In raised-floor layouts, consider a side or top cover for partial containment; on a raised floor these fully prevented recirculation.
Monthly newsletter · free
Keep your reading list current
Once a month: new library sources, changes to Turkish regulations and upcoming data centre events.
SoSo CAD
Check cooling capacity alongside your design
Review zone heat loads, available capacity and the capacity balance after the largest unit is lost in SoSo CAD.
Request a demo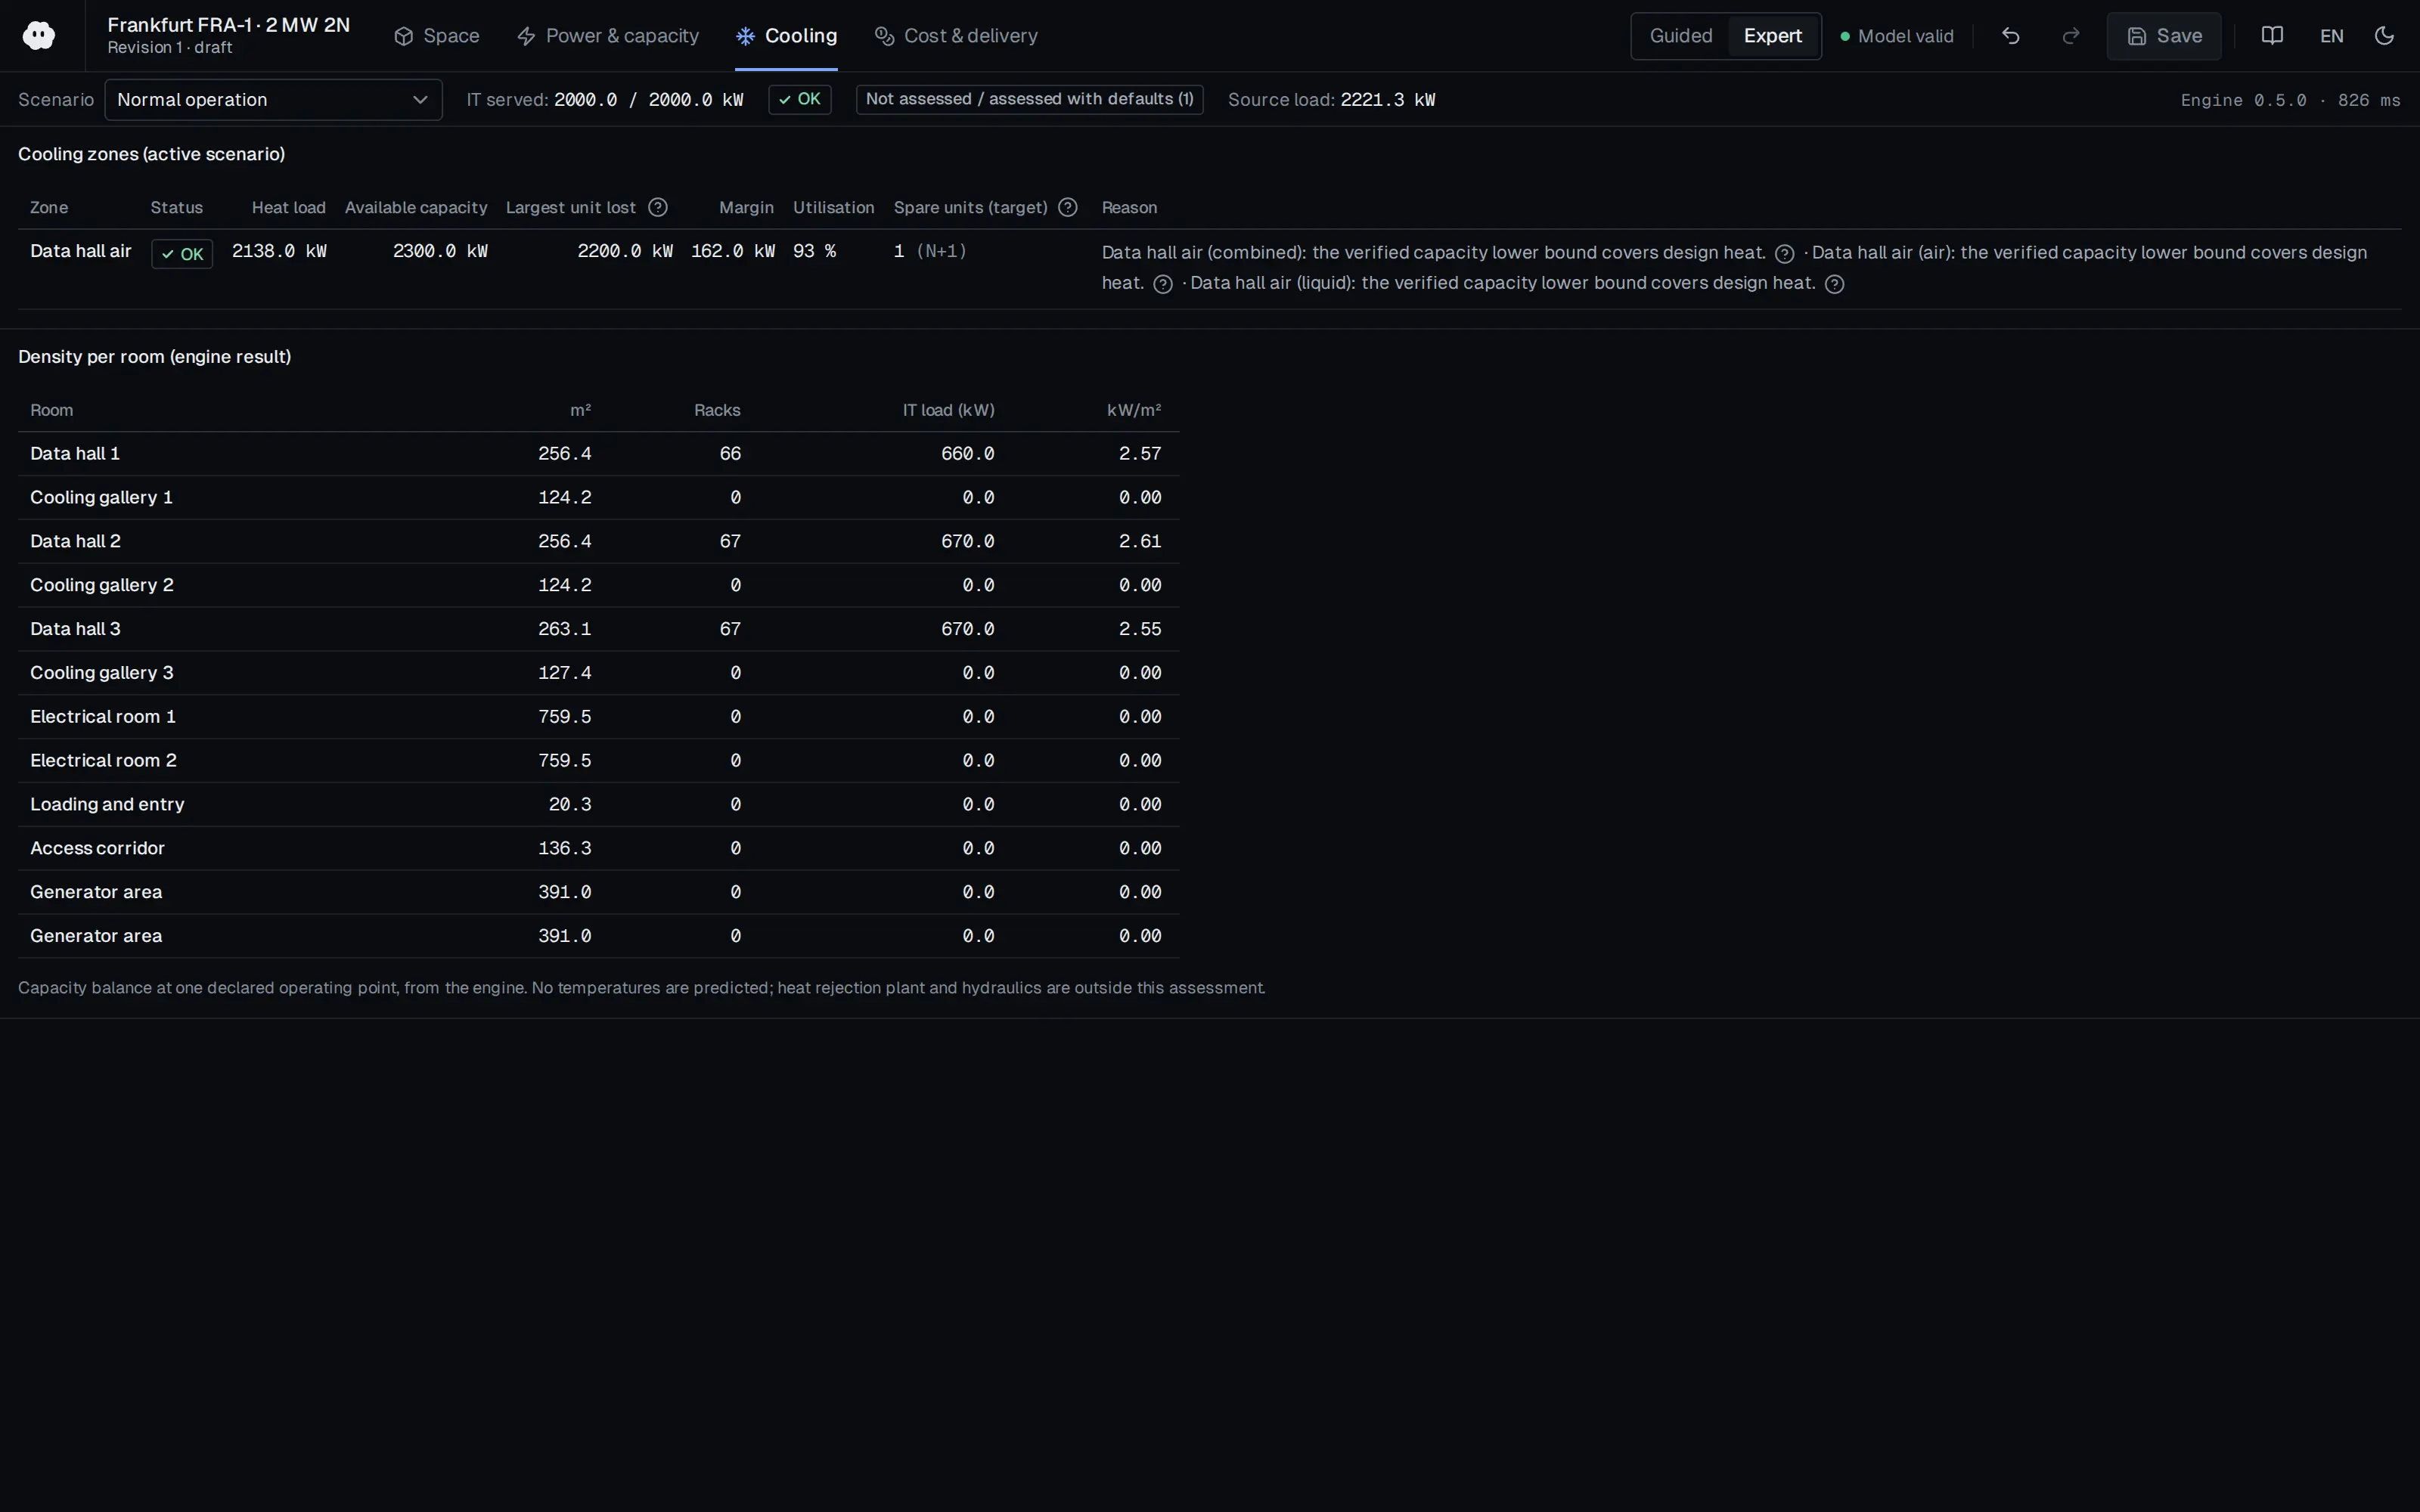
Who should read it
Cooling engineers evaluating partial aisle containment and supply-flow reduction using airflow metrics.
Document contents
- 1. Introduction
- 2. Method (2.1 Geometry, 2.2 Boundary Conditions, 2.3 Validation, 2.4 Grid Study, 2.5 Simulation Settings, 2.6 Performance Metrics)
- 3. Results and Discussion (3.1 Grid Study, 3.2 Validation, 3.3 Flow Field, 3.4 Comparison of Setups at Operating Conditions, 3.5 Comparison of Setups with 50% Supply Flow Rate)
- 4. Conclusions
Related standards
- ASHRAE TC 9.9 Thermal Guidelines for Data Processing Environments
Read the document
partial-aisle-containment-metrics-2019.pdf
CC BY 4.0 — share with attribution
The document is provided unaltered because its licence permits redistribution.
Publication details
- Authors
- Emelie Wibron; Anna-Lena Ljung; T. Staffan Lundström
- Publisher
- Energies (MDPI AG)
- Year
- 2019
- Volume
- 12
- Issue
- 8
- Pages
- 1473
- Document language
- English
- Source type
- Scientific
- Access
- Open licence — downloadable
- Licence
- CC BY 4.0 — share with attribution
- Licence evidence
- www.mdpi.com
Original licence note
PDF p.1: open access article distributed under the terms and conditions of the Creative Commons Attribution (CC BY) license.
Citation
Emelie Wibron; Anna-Lena Ljung; T. Staffan Lundström (2019). Comparing Performance Metrics of Partial Aisle Containments in Hard Floor and Raised Floor Data Centers Using CFD. Energies (MDPI AG). 12(8), 1473. https://doi.org/10.3390/en12081473
Events on this subject
Browse the events calendarAll content and rights belong to the respective authors and publishers. SoSo CAD provides only the citation, its own summary and a link to the source, and is not responsible for the sources' content.
Related sources
All sources on this topic
Buildings (MDPI AG) 2026
Thermal Environment Assessment for Energy-Efficient Cooling in Air-Cooled Data Centers: Measurement, CFD, and Predictive Models
In a design tool, set CFD accuracy expectations from this review's ranges (0.1-4 °C absolute, relative mostly below 20%) and do not limit validation scope to temperature; ask for velocity and pressure too.
- Of the 58 CFD studies, Fluent was used in 24 (41.4%) and 6SigmaDC in 12; standard k-epsilon in 41 (about 70.7%).
Applied Sciences (MDPI AG) 2025
Optimization of Airflow Organization in Bidirectional Air Supply Data Centers in China
In retrofitting an existing raised-floor hall, first close unused rack spaces with blanking panels (alone they cut SHI by 42.61%); containment alone gave little benefit.
- Baseline RTI 0.786, SHI 0.230, RCI-HI 0.992. Blanking alone: SHI 0.132, RCI-HI 1. Blanking plus full CAC (Case 7): RTI 1, SHI 0.027.
Scientific Reports (Springer Science and Business Media LLC) 2025
Energy efficiency enhancement in two European data centers through CFD modeling
Set up the retrofit workflow as KPI-guided: with a validated CFD model compute RCI, RHI, RTI and the recirculation index, then test rack repositioning, separators, sealing unused bays and removing badly placed ventilation units in sequence.
- KPI limits: ASHRAE recommended 18-27 °C and allowable 15-32 °C inlet temperatures.
European Commission JRC 2025
2025 Best Practice Guidelines for the EU Code of Conduct on Data Centre Energy Efficiency (JRC141521, EUR 40267)
Design the facility to operate within the ASHRAE Class A2 allowable range and require A2 operation within warranty in IT procurement; plan separate environmental zones (practice 5.3.4) for legacy equipment.
- IT equipment AC/DC power converters should be rated at 90% efficiency or better across expected load ranges.
Frontiers in Built Environment (Frontiers Media SA) 2024
Effects and optimization of airflow on the thermal environment in a data center
Make aisle containment the default in raised-floor or in-row cooling: containment raised ASE from 65.69% to 85.57-90.25% and brought SHI close to zero.
- Without containment, cabinet No. 19 had a mean inlet temperature of 30.1 °C and a maximum of 36.7 °C, and ten cabinets went above the 27 °C limit.
U.S. DOE FEMP / NREL 2024
Best Practices Guide for Energy-Efficient Data Center Design (Revised July 2024)
Weigh the supply air setpoint against server fan energy: raise it in small steps within the ASHRAE recommended range so the most demanding inlet nears 80 °F, only after air management is in place, and control to IT inlet temperature rather than return temperature.
- Compute racks reached 60 kW in 2013, and recent liquid-cooled racks exceed 125 kW.