
Power and Cooling Capacity Management for Data Centers
Schneider Electric · Neil Rasmussen
Schneider Electric WP 150 sets out a framework for managing power and cooling capacity at the rack level, with supply and demand each described as an as-configured maximum and a current actual value.
On this page
Overview
Four values are defined for each rack: as-configured maximum potential demand, current actual demand, as-configured potential supply and current actual supply. Server power management can make power vary by 2 to 1 or more in typical operation, which is what separates maximum potential demand from actual demand. Actual supply below potential supply indicates a degraded state, such as blocked filters or a lost UPS module. Supply must exceed demand at every rack and at every upstream device: PDU, UPS, cooling units and service entrance.
The resulting excess is classified as spare, idle, safety-margin or stranded capacity. Safety margins of 10% to 20% are typical, with 30% or more in data centres with weak change control. Stranded capacity arises when space, power, power distribution, cooling and cooling distribution are out of balance at a location; examples are a PDU with capacity but no breaker positions, or a 1 MW facility unable to cool new blades at a 200 kW load.
The paper also supplies density and efficiency figures. IT equipment drawing more than 8 kW per rack can be considered high density, fully populated server racks can draw 6 kW to 35 kW, and most data centres are designed for less than 4 kW per rack. A typical data centre could hold up to 30% more IT equipment with the same power and cooling capacity if managed properly, and poor utilization drives electrical consumption up by 20% or more. IT equipment refresh cycles are typically below three years.
A capacity management system needs hierarchical presentation from organization to rack, a way to set a capacity plan, alerting on plan violations, and modeling of proposed changes and faults. Alarms should fire on rack, row or room consumption above plan peak, on loss or degradation of power or cooling capacity, and on loss of planned redundancy, even when no hardware fault exists.
Key points
- More than 8 kW per rack is high density; full server racks draw 6-35 kW; most data centres are designed for under 4 kW per rack.
- A typical data centre could hold up to 30% more IT equipment on the same capacity if well managed; poor utilization raises consumption by 20% or more.
- Server power management can swing power 2 to 1 or more, defining as-configured maximum versus actual demand.
- The rack model holds four values: as-configured maximum demand, actual demand, as-configured potential supply, actual supply; actual below potential is a degraded state (blocked filters, lost UPS module).
- Safety margins are typically 10-20%, up to 30% or more with weak change control.
- Stranded capacity comes from imbalance among space, power, power distribution, cooling and cooling distribution: a PDU with no breaker positions, a 1 MW facility unable to cool 200 kW of new blades.
- IT equipment refresh cycles are typically below three years.
- Alarms should fire on consumption above plan peak, loss or degradation of capacity, and loss of planned redundancy, even without a hardware fault.
Using it in design
- For every rack, row and upstream device store design maximum supply, design maximum demand (nameplate or as-configured) and measured actual where available; enforce supply >= demand at each hierarchy level including under N-1.
- Default the safety margin to 10-20% (prompt for 30% if change control is weak) and show it as unusable.
- Flag stranded capacity per location by comparing space, power, breaker positions, cooling and airflow headroom.
- Treat more than 8 kW/rack as high density and warn when it is placed in a hall designed for under 4 kW/rack; export the capacity plan to DCIM for operational alerting.
Monthly newsletter · free
Keep your reading list current
Once a month: new library sources, changes to Turkish regulations and upcoming data centre events.
SoSo CAD
Assess redundancy through scenarios
Compare normal operation and equipment failures in SoSo CAD, with supplied loads and capacity shortfalls in one view.
Request a demo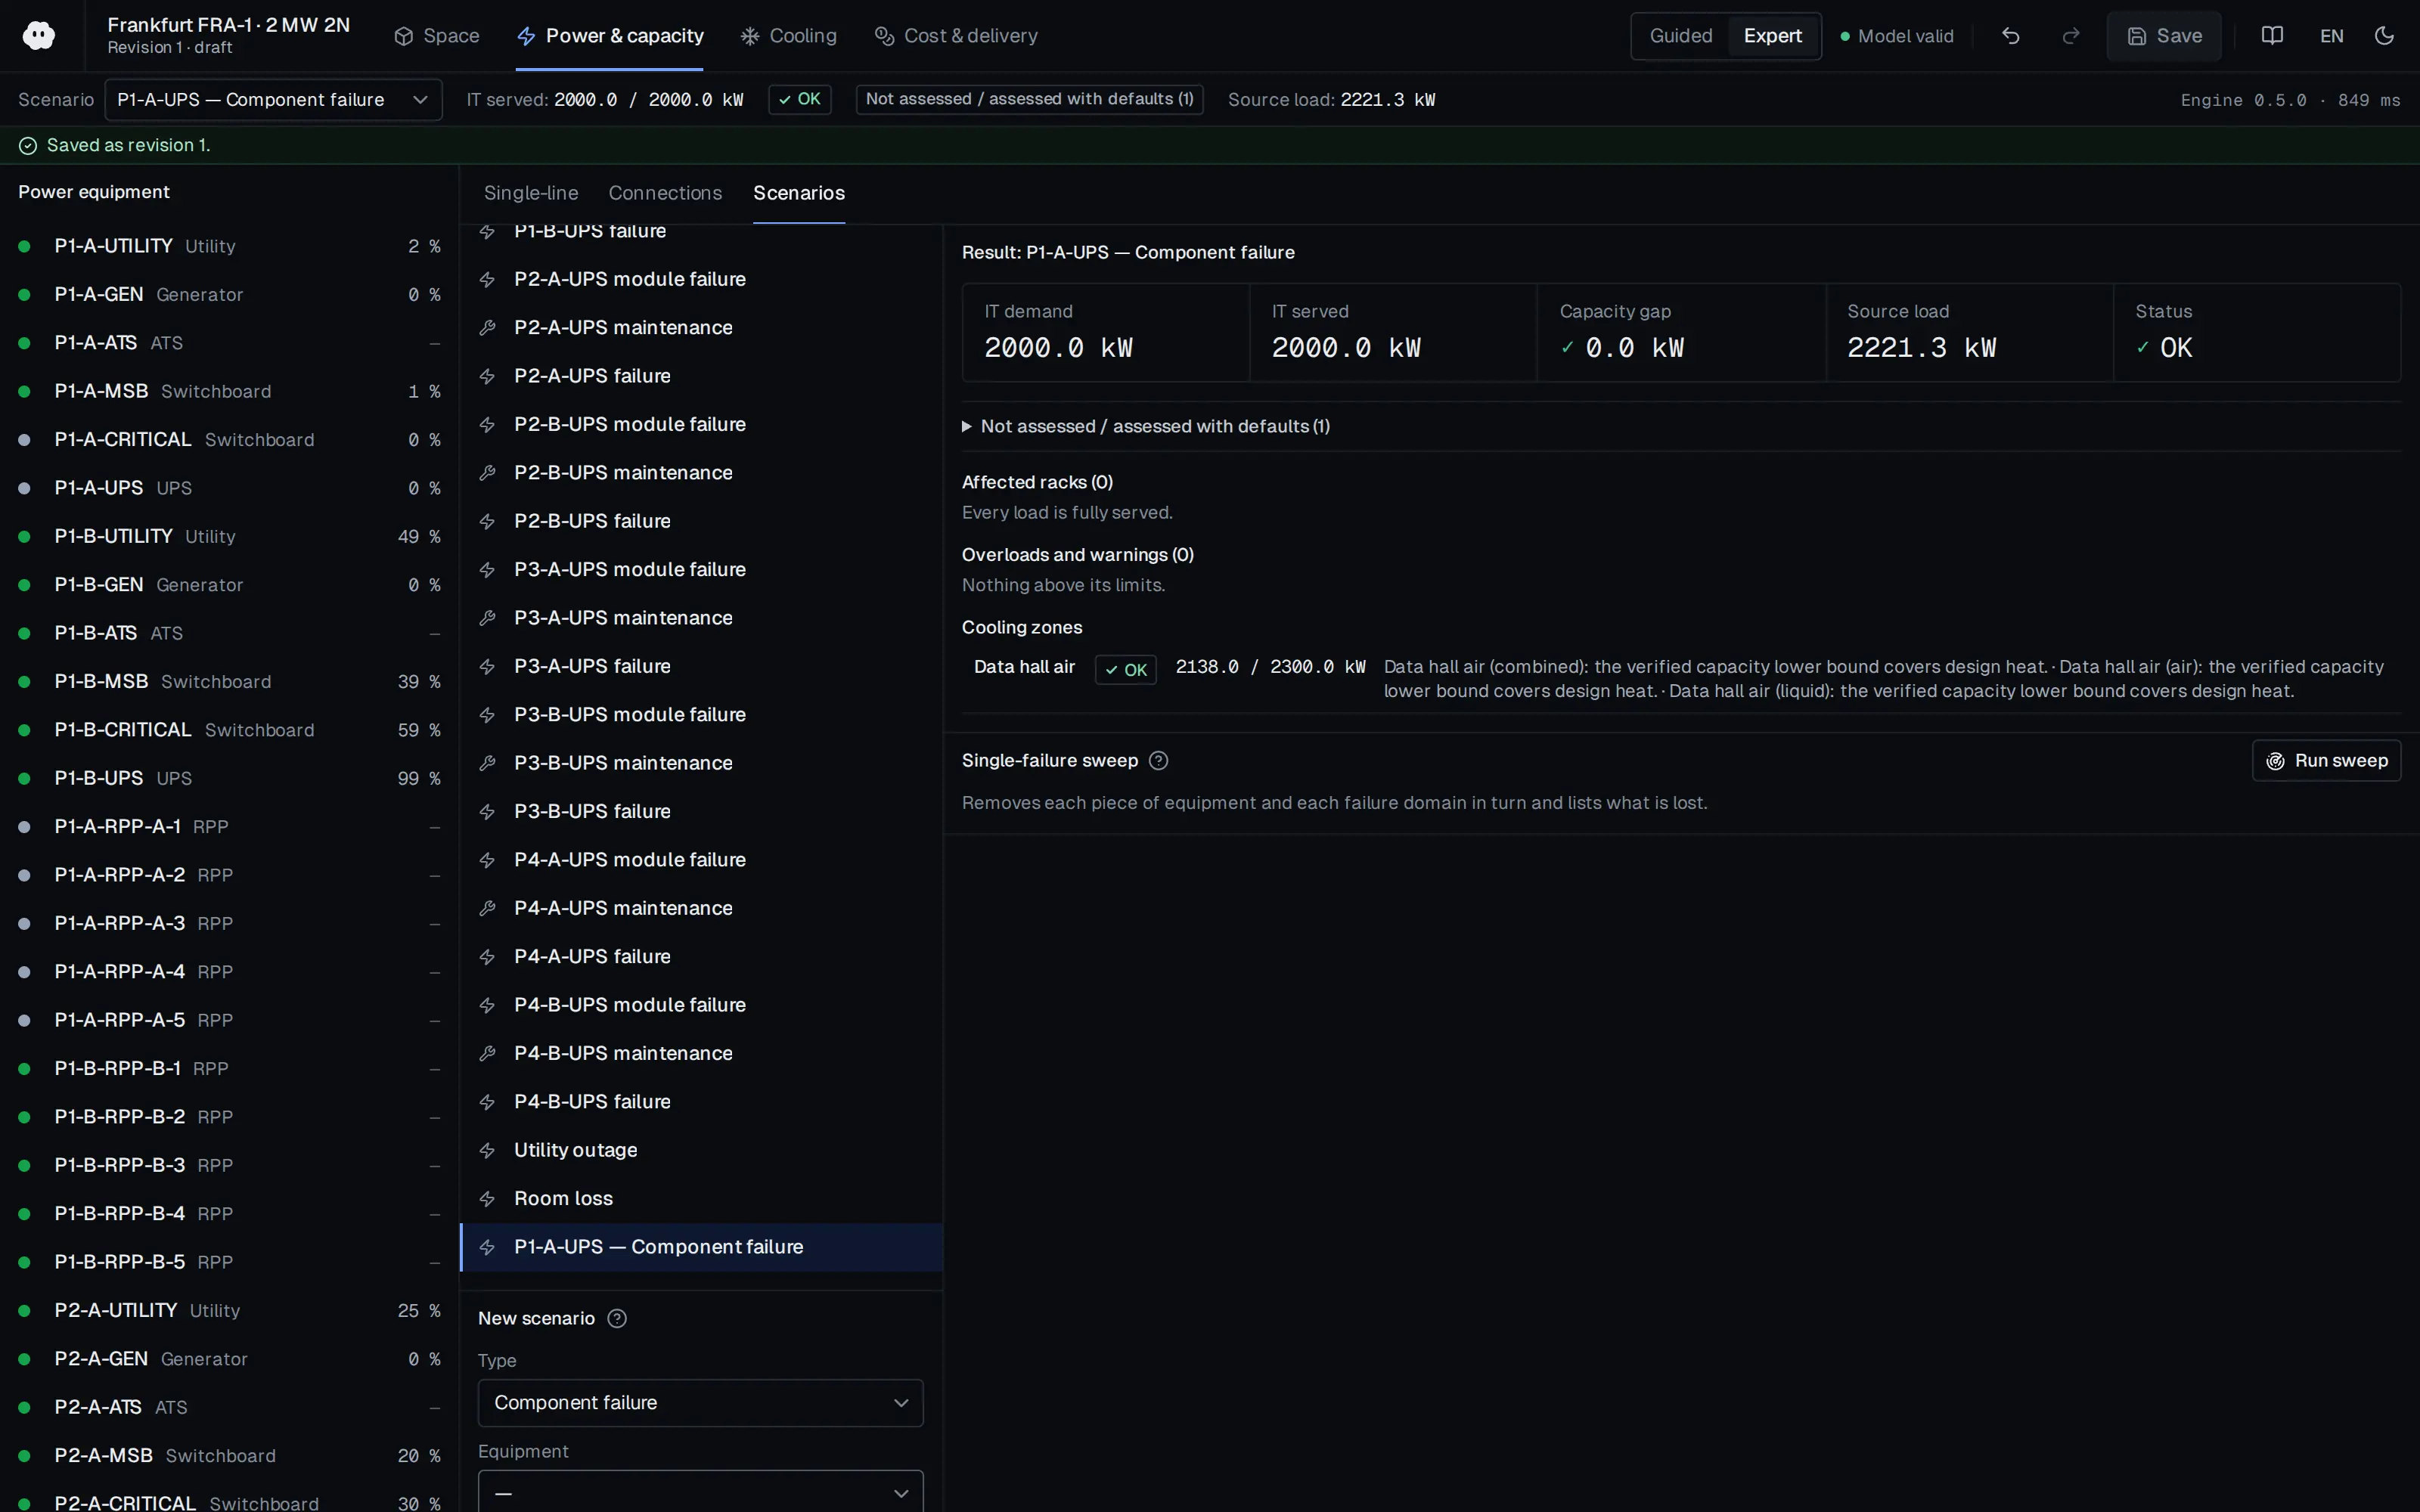
Who should read it
Operations engineers planning capacity in existing facilities and teams building a rack-level capacity model at design time.
Publication details
- Authors
- Neil Rasmussen
- Publisher
- Schneider Electric
- Year
- 2024
- Document number
- WP 150
- Document language
- English
- Source type
- Manufacturer
- Access
- Free to read
- Licence
- Copyright retained; citation only — the publisher’s terms apply to the original document
Citation
Neil Rasmussen (2024). Power and Cooling Capacity Management for Data Centers. Schneider Electric. WP 150. https://download.schneider-electric.com/files?p_Doc_Ref=SPD_NRAN-6C25XM_EN
Events on this subject
Browse the events calendarAll content and rights belong to the respective authors and publishers. SoSo CAD provides only the citation, its own summary and a link to the source, and is not responsible for the sources' content.