
Free Cooling for Saving Energy: Technical Market Analysis of Dry, Wet, and Hybrid Cooling Based on Manufacturer Data
Energies (MDPI AG) · Paula M. Wenzel, Marc Mühlen et al.
A statistical market survey of 6730 packaged heat-rejection models from 27 manufacturers in six classes: dry coolers, closed and open wet towers, and three hybrid types, giving quartile ranges for approach temperature, specific fan and pump electricity and specific water consumption.
CC BY 4.0 — share with attribution
On this page
Overview
In light of energy and climate targets, free cooling unlocks a major resource-saving potential compared with refrigeration; to quantify it, the study specifies the physical and technical limits of cooling tower applications and provides comprehensive data on electricity and water consumption. Six types of package-type cooling towers are distinguished: dry, closed wet, open wet and three hybrid systems (wetted, sprayed, wetting-mat). One generalised system is defined for all types to enable comparability, and data were collected from the data sheets of 6730 system models of 27 manufacturers.
Median approach is 10 K to ambient dry-bulb for dry coolers, 5 K to wet-bulb for open wet towers and 6.5 K to wet-bulb for closed-circuit wet towers; wet cooling also needs about a 5 K safety gap from freezing. All tower types show a typical coolant range of at least 5 K, so tower free cooling is mostly not feasible if the outlet must be less than 5 K above the inlet.
Specific electricity demand ranges from 0.01 to 0.06 kWel/kWth across types; open wet towers are lowest at about 0.012-0.021 kWel/kWth, and refrigeration would use roughly ten times more electricity per unit cooling. At 32/27/21 °C, interquartile specific water consumption was 3.32-4.60 l/h/kWth for sprayed hybrid and 2.06-2.69 l/h/kWth for wetting-mat hybrid coolers; dry coolers use 0. For Stuttgart, with a required coolant temperature of 25 °C, dry cooling covers about 72.8% of annual hours versus 98.0-99.6% for wet and hybrid cooling; at 20 °C, 52.2% versus 79.2-87.9%. Minimum outlet temperatures with evaporative cooling are up to 16 K lower than with dry cooling.
Limits: data come from manufacturer data sheets, not measured field performance, and values at standard operating points can differ from real operating conditions. The study gives benchmark data for modelling dry versus evaporative heat rejection in data centres and industry.
Key points
- Median approach is 10 K to ambient dry-bulb for dry coolers, 5 K to wet-bulb for open wet towers and 6.5 K to wet-bulb for closed-circuit wet towers; wet cooling also needs about a 5 K safety gap from freezing.
- All tower types show a typical coolant range of at least 5 K, so tower free cooling is mostly not feasible if the outlet must be less than 5 K above the inlet.
- Specific electricity demand ranges from 0.01 to 0.06 kWel/kWth; open wet towers are lowest at about 0.012-0.021, and refrigeration would use roughly ten times more electricity per unit cooling.
- At 32/27/21 °C, interquartile specific water consumption was 3.32-4.60 l/h/kWth for sprayed hybrid and 2.06-2.69 l/h/kWth for wetting-mat hybrid; dry coolers use 0.
- For Stuttgart at a required coolant temperature of 25 °C, dry cooling covers about 72.8% of annual hours versus 98.0-99.6% for wet and hybrid; at 20 °C, 52.2% versus 79.2-87.9%.
- Minimum outlet temperatures with evaporative cooling are up to 16 K lower than with dry cooling.
Using it in design
- Check free-cooling feasibility from the required coolant outlet temperature, the tower approach (dry 10 K, open wet 5 K, closed wet 6.5 K) and the at-least-5 K coolant range.
- When choosing between dry and wet heat rejection, compare annual free-cooling hours (72.8% versus 98-99.6% at 25 °C) together with specific water consumption (0 versus 2-4.6 l/h/kWth).
- Use free cooling's electricity advantage (0.012-0.06 kWel/kWth, roughly one tenth of refrigeration) as an input in the energy model.
Monthly newsletter · free
Keep your reading list current
Once a month: new library sources, changes to Turkish regulations and upcoming data centre events.
SoSo CAD
Check cooling capacity alongside your design
Review zone heat loads, available capacity and the capacity balance after the largest unit is lost in SoSo CAD.
Request a demo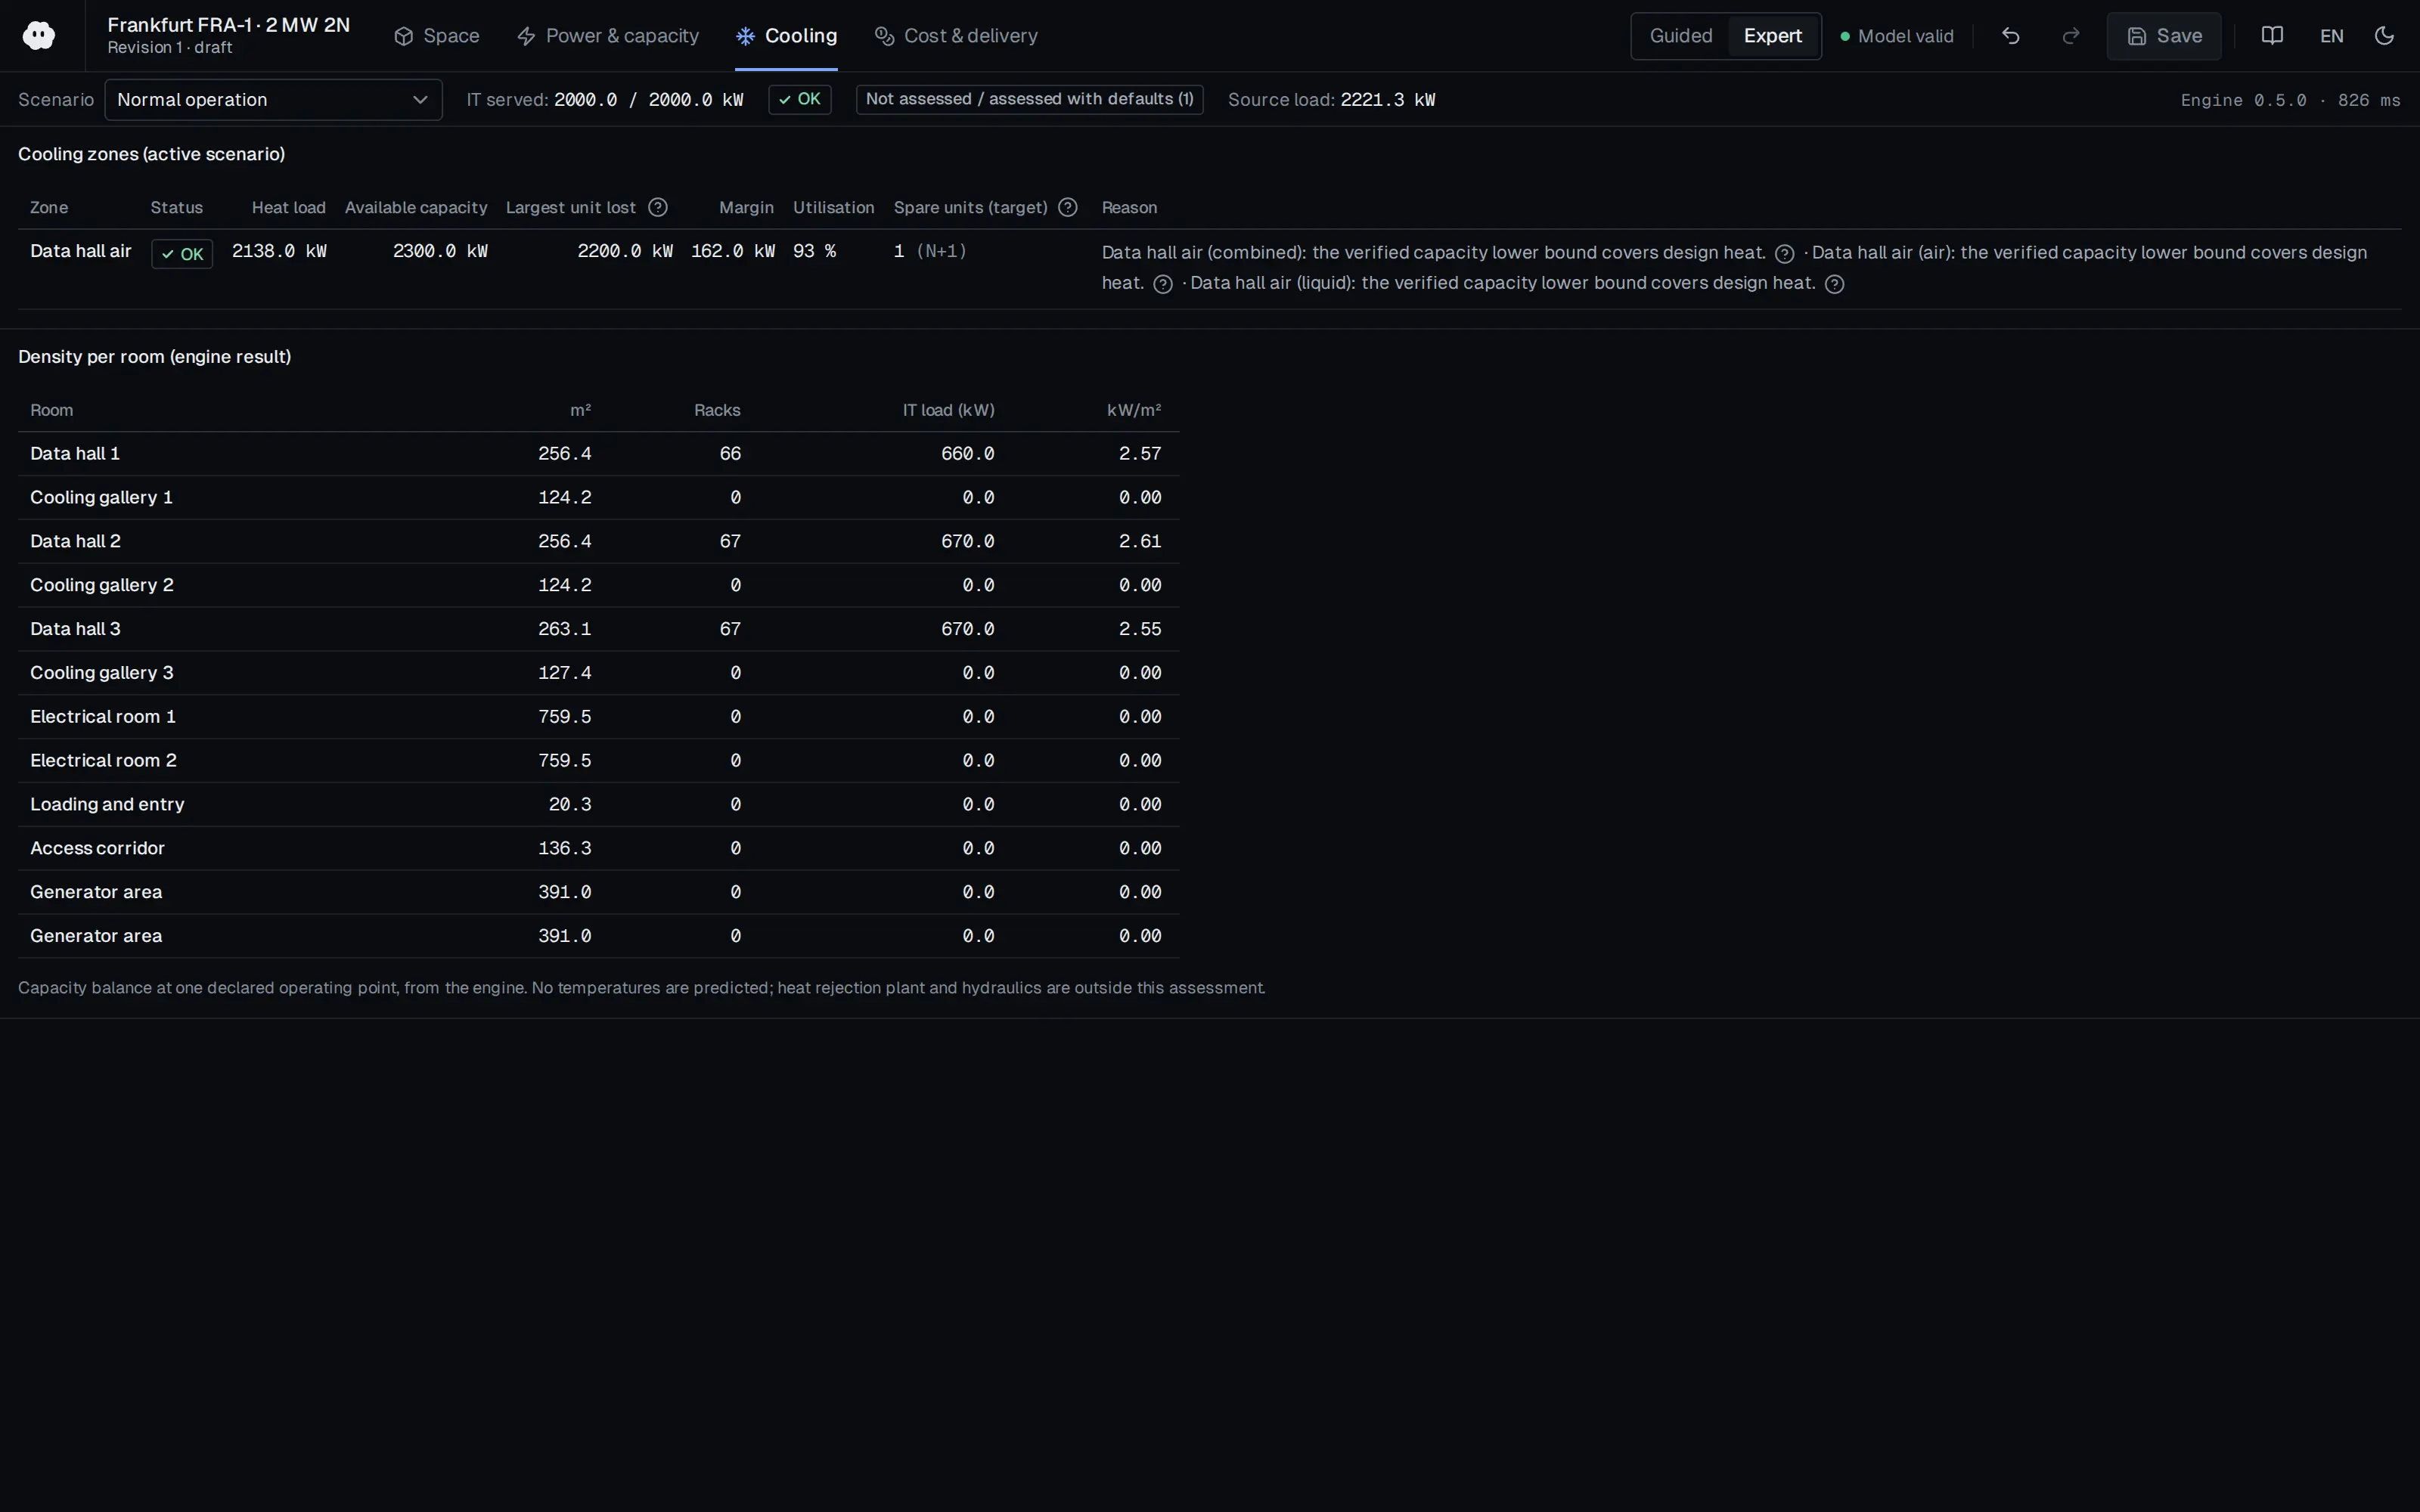
Who should read it
Cooling designers and energy modellers selecting dry, wet and hybrid heat-rejection equipment.
Document contents
- 1. Introduction (1.1 Previous Research, 1.2 Study's Objective)
- 2. Materials and Methods (2.1 System Definition, 2.2 Data Acquisition, 2.3 Statistical Evaluation)
- 3. Results (3.1 Limits of Cooling Tower Use, 3.2 Electricity and Water Consumption, 3.3 Exemplary Application)
- 4. Discussion
- 5. Conclusions and Outlook
Read the document
dry-wet-hybrid-free-cooling-market-2023.pdf
CC BY 4.0 — share with attribution
The document is provided unaltered because its licence permits redistribution.
Publication details
- Authors
- Paula M. Wenzel; Marc Mühlen; Peter Radgen
- Publisher
- Energies (MDPI AG)
- Year
- 2023
- Volume
- 16
- Issue
- 9
- Pages
- 3661
- Document language
- English
- Source type
- Scientific
- Access
- Open licence — downloadable
- Licence
- CC BY 4.0 — share with attribution
- Licence evidence
- www.mdpi.com
Original licence note
p.1 states the article is open access under the Creative Commons Attribution (CC BY) licence.
Citation
Paula M. Wenzel; Marc Mühlen; Peter Radgen (2023). Free Cooling for Saving Energy: Technical Market Analysis of Dry, Wet, and Hybrid Cooling Based on Manufacturer Data. Energies (MDPI AG). 16(9), 3661. https://doi.org/10.3390/en16093661
Events on this subject
Browse the events calendarAll content and rights belong to the respective authors and publishers. SoSo CAD provides only the citation, its own summary and a link to the source, and is not responsible for the sources' content.
Related sources
All sources on this topic
Buildings (MDPI AG) 2026
Load-Adaptive Operational Control of an Indirect Evaporative Cooling System for Coordinated Energy and Water Use in a Modular Data Center in a Cold Region
In IEC control, stage airflow to follow load rate and spray to follow room temperature, and prefer a low fresh/return air ratio.
- Going from load rate 0.7 to 1.0 raised annual electricity by 16.2% but water by 74.8% and WUE by 70.6%.
Buildings (MDPI AG) 2024
Performance and Applicability Analysis of Indirect Evaporative Cooling Units in Data Centers Across Various Humidity Regions
Assess an IEC unit by climate: natural cooling covered 97% of the year in a dry climate and 43% in a humid one; check the wet-bulb distribution (19 °C threshold) against project climate data.
- Against packaged air-cooled DX units, IEC energy savings were 57.46% (Urumqi), 48.26% (Beijing) and 39.41% (Shanghai).
arXiv (University of Michigan preprint) 2026
Data Center Cooling Choices Shift Water Impacts Across the Grid: An Integrated Water-Energy Model for Sustainable Data Center Development
In cooling selection, calculate direct and indirect water together: an air-cooled chiller cut direct water 97% but raised the indirect share to 96.6% and electricity by 32%.
- Indirect water intensity varied by about 50% across months, depending on which generators supplied the added load.
Open Compute Project Foundation 2026
Guidelines: Impact of Strategies on Data Center Energy Consumption, Carbon Footprint, and Water Consumption (March 2026)
Evaluate cooling and siting options on energy, carbon, site water and water scarcity together, not on PUE or WUE alone.
- Same example: emissions fall from 3,500 to 2,700 t CO2/yr with the carbon factor of 0.26 kg CO2/kWh.
Open Compute Project Foundation 2023
Data Centers Heat Reuse 101
A heat-reuse module should report recoverable heat (kW) and its temperature band by cooling technology (air, RDHx, DLC/immersion) and suggest compatible heat-host categories.
- Containerised/modular data centres can exceed 0.5 MW, a significant heat quantity for many local applications.
Resources, Conservation and Recycling (Elsevier BV) 2022
Climate- and technology-specific PUE and WUE estimations for U.S. data centers using a hybrid statistical and thermodynamics-based approach
In early data-centre design, set PUE and WUE targets by size class, cooling system and climate zone using this study's ranges (for example 1.71-2.22 for small rooms, 1.12-1.25 for large scale).
- Airside economisers with adiabatic cooling (case 1) use less water than airside economisers alone (case 3).