
Introducing Power Compute Effectiveness (PCE), a Provisioned Capacity Allocation Metric for the New Data Center Era (October 2026)
Open Compute Project Foundation · Chen, Y., Quigley, P. et al.
An OCP white paper proposing PCE, a design-stage metric of how much of a site's provisioned electrical capacity is structurally available to IT compute after cooling, conversion and distribution losses, and auxiliary loads. Where PUE measures operating energy, PCE exposes stranded power at design time.
CC BY-SA 4.0 — share with attribution under the same licence
On this page
Overview
The paper starts from the observation that, as rack densities and AI demand grow, operators are constrained less by floor space than by how provisioned electrical capacity is distributed inside existing infrastructure. In many facilities a significant share of contracted and installed power goes to cooling, electrical losses and auxiliary loads before reaching IT equipment. Existing metrics mostly evaluate operating efficiency, so they do not expose this structural constraint at design or planning stage. PCE is proposed to fill that gap.
The metric is PCE = P_ITcompute,prov / P_facility,prov under a declared facility boundary and redundancy basis (N, N+1, 2N), a dimensionless value between 0 and 1. P_ITcompute,prov is derived, not measured: provisioned facility capacity minus provisioned cooling and heat-rejection power, electrical conversion and distribution losses, and auxiliary loads. Two declarations are mandatory before calculation, the electrical boundary and the redundancy basis, and every variable is evaluated on that basis.
Source rules for the four inputs are detailed. Facility capacity rests on the single-line diagram, commissioning report and nameplates, with one disclosed basis such as the utility interconnection agreement, transformer rating, main switchgear nameplate (kVA converted to kW at a declared power factor) or aggregate UPS output. Cooling comes from mechanical schedules, OEM submittals and panel schedules, with motor horsepower converted at HP x 0.746, and modelled values without OEM documentation are not permitted. Metered operating data may validate but never serve as the primary input.
The paper compares PCE with PUE, DCiE, IUE, TUE, CUE and WUE and stresses that it complements them: the others address operating energy, utilization, emissions or water, while PCE addresses design-level capacity allocation. Two worked examples are given. In a 20 MW N+1 Tier III colocation site, 4.8 MW cooling, 0.7 MW losses and 0.4 MW auxiliaries leave 14.1 MW for IT, PCE 0.705. In a 100 MW hyperscale campus, 16.0 MW cooling, 3.5 MW losses and 1.5 MW auxiliaries leave 79.0 MW, PCE 0.790.
The scenarios are explicitly representative composites that illustrate the method; they set no target values and prescribe no design. Suggested applications are retrofit prioritization, cooling-architecture comparison, capacity planning and portfolio analysis. The paper's stated limits and positioning: PCE is independent of workload type and actual utilization, needs no new metering, and can be computed before commissioning. It is licensed CC BY-SA 4.0 and dated October 2026.
Key points
- PCE = P_ITcompute,prov / P_facility,prov, dimensionless between 0 and 1; P_ITcompute,prov = P_facility,prov - (P_CoolReject,prov + P_ElecLoss,prov + P_Aux,prov).
- Two declarations are mandatory before calculation: the facility electrical boundary and the redundancy basis (N, N+1, 2N).
- Inputs must come from utility agreements, nameplates, issued-for-construction drawings, commissioning reports and OEM submittals; modelled values without OEM documentation are not allowed.
- Motor horsepower converts at HP x 0.746; kVA ratings convert to kW at the declared power factor.
- Planning conditions (IT load percentage, ambient temperature, supply/return temperatures) must be disclosed with the PCE value.
- Metered operating data may validate the result but cannot be the primary input.
- PCE differs from PUE, DCiE, TUE, CUE and WUE: those measure operating energy or resources, PCE measures provisioned capacity allocation; it complements rather than replaces them.
- Example 1: 20 MW N+1 colocation; 4.8 MW cooling, 0.7 MW losses, 0.4 MW auxiliaries, 14.1 MW for IT, PCE 0.705.
- Example 2: 100 MW hyperscale campus; 16.0 MW cooling, 3.5 MW losses, 1.5 MW auxiliaries, 79.0 MW for IT, PCE 0.790.
- Applications: retrofit prioritization, cooling-architecture comparison, capacity planning and portfolio-level analysis.
Using it in design
- Compute PCE automatically from the design model: utility/transformer capacity as P_facility, peak cooling electrical input at design ambient, UPS/transformer/busway losses and auxiliary panel loads, all on the declared redundancy basis.
- Show stranded capacity (MW) next to PUE so users see the trade-off between cooling choices (chiller kW/ton, liquid cooling) and sellable IT MW.
- Require boundary and redundancy declarations in the report header.
- Take cooling inputs from equipment schedules and OEM submittals; flag modelled values and exclude them from any PCE claim.
- Use the two worked examples (0.705 and 0.790) as calculation tests for the tool.
- For retrofit prioritization, rank portfolio sites by PCE and by stranded MW.
Monthly newsletter · free
Keep your reading list current
Once a month: new library sources, changes to Turkish regulations and upcoming data centre events.
SoSo CAD
Compare the cost of design decisions
Evaluate equipment costs, energy expenses and total cost of ownership (TCO) using your inputs and assumptions in SoSo CAD.
Request a demo
Who should read it
Data-centre designers, capacity planners and investment decision makers evaluating capacity allocation at design stage.
Document contents
- Introduction
- Compliance with Open Compute Project Tenets
- PCE Framework and Methodology
- Metric Definition
- Required Declarations
- Variable Definitions
- Six requirements to claim PCE compliance
- Relationship to Existing Metrics
- Applied Scenarios
- Enterprise Colocation: 20 MW Tier III Facility (N+1)
- Hyperscale Campus: 100 MW Facility
- Observations and Adoption
- Operational Applications of PCE
- Conclusion
- Glossary
- References
- License
Related standards
- ISO/IEC 30134-2 (PUE)
- The Green Grid DCiE / TUE / ITUE
- OCP Sustainability Metrics Considerations - PUE
Read the document
ocp-power-compute-effectiveness.pdf
CC BY-SA 4.0 — share with attribution under the same licence
The document is provided unaltered because its licence permits redistribution.
Publication details
- Authors
- Chen, Y.; Quigley, P.; Roberts, J. (Airsys)
- Publisher
- Open Compute Project Foundation
- Year
- 2026
- Document language
- English
- Source type
- Industry body
- Access
- Open licence — downloadable
- Licence
- CC BY-SA 4.0 — share with attribution under the same licence
- Licence evidence
- www.opencompute.org
Original licence note
Pages 2-3 and page footers state the work is licensed under a Creative Commons Attribution-ShareAlike 4.0 International License.
Citation
Chen, Y.; Quigley, P.; Roberts, J. (Airsys) (2026). Introducing Power Compute Effectiveness (PCE), a Provisioned Capacity Allocation Metric for the New Data Center Era (October 2026). Open Compute Project Foundation. https://www.opencompute.org/documents/power-compute-effectiveness-pce-white-paper/
Events on this subject
- Electricity Eurasia 2027
- ELECO 2026 Elektrik-Elektronik ve Biyomedikal Mühendisliği Konferansı
- 7x24 Exchange Spring Conference
All content and rights belong to the respective authors and publishers. SoSo CAD provides only the citation, its own summary and a link to the source, and is not responsible for the sources' content.
Related sources
All sources on this topic
International Energy Agency 2025
Energy and AI (World Energy Outlook Special Report)
Use the IEA component split (servers about 60%, storage about 5%, network up to 5%, cooling 7-30%) to sanity-check modelled energy breakdowns.
- The 2035 range across cases is 700-1,700 TWh; the High Efficiency Case is 20% below the Base Case.
U.S. EPA / ENERGY STAR 2024
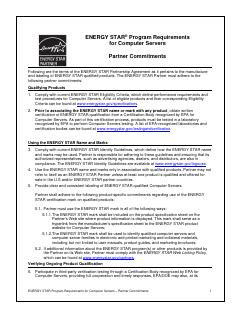
ENERGY STAR Program Requirements for Computer Servers, Version 4.0 (Partner Commitments, Eligibility Criteria, and Final Test Method Rev. April 2023)
Write ENERGY STAR Version 4.0 certification and the PSU efficiency steps (at 10% to 100% load points) into the server procurement specification; look especially at 10% and 20% load efficiency for redundant supplies that run lightly loaded.
- EffACTIVE = EXP(0.65 ln EffCPU + 0.30 ln EffMEMORY + 0.05 ln EffSTORAGE).
U.S. DOE FEMP / NREL 2024
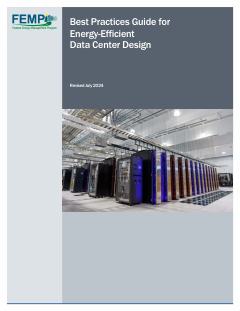
Best Practices Guide for Energy-Efficient Data Center Design (Revised July 2024)
Weigh the supply air setpoint against server fan energy: raise it in small steps within the ASHRAE recommended range so the most demanding inlet nears 80 °F, only after air management is in place, and control to IT inlet temperature rather than return temperature.
- Compute racks reached 60 kW in 2013, and recent liquid-cooled racks exceed 125 kW.
TÜV NORD 2026
EN 50600 — data centre facilities and infrastructures (overview and certification)
In an 'EN 50600' standards profile, offer separate availability-class selectors for power, cooling and cabling (instead of a single Tier), plus a protection-class selector per room or zone
- Protection classes 1-4 for unauthorised access and other hazards; physical-security zoning required
7x24 Exchange Magazine 2024
Divide and Conquer: Understanding the Impact of Modular Data Room Design Approach on PUE (Jorge A. Gil)
Compute and plot PUE versus IT load for phased designs, showing step changes when each POD or block is energized.
- Related document: ISO/IEC 30134-2 (PUE).
Socomec 2024
Data centre - How to ensure power availability, electrical safety and energy performance? (Expert advice & innovative solutions guide)
In the single-line editor, tag transfer devices as ATSE (IEC 60947-6-1) or STS with a transfer-time field, and suggest STS where the load needs under about 10 ms.
- Human error accounts for 22 % of unplanned outages.