
Rack Density is Rising (Andy Lawrence)
Uptime Institute Journal · Andy Lawrence
An Uptime Institute Journal article summarising Uptime's 2020 survey data: rack density is climbing, but the long-forecast industry-wide shift to 20 kW racks has not happened.
On this page
Overview
This article, by Andy Lawrence, was published in the Uptime Institute Journal in 2020 and is freely available. It summarises Uptime's 2020 survey data on rack power density. Its main message is that average density is climbing steadily, but the long-forecast industry-wide shift to 20 kW racks has not happened. The most compute-intensive loads sit in a small group of hyperscale, HPC and specialist sites. The article distinguishes highest, mean and modal (most common) rack density as planning metrics.
According to the findings, most respondents reported their highest-density racks in the 10-19 kW range year over year. In 2020, 71% reported a modal server rack density below 10 kW, and only 16% widely deployed 20 kW or more. Mean density was calculated after excluding respondents above 30 kW as high-performance outliers. This distinction shows that looking only at the average can mislead facility planning.
About half of organizations said their average density was increasing. Virtualization, containers and slowing Moore's law push utilization and per-rack power upward. The article rests on 2020 data; the effect of AI loads in later years is outside its scope. These trends suggest that the average rises slowly while extremes can climb much faster. Cooling and power distribution should therefore be sized for the cluster formed by the densest racks in the facility, not only for the average; otherwise a design based on the average may not carry a high-density cluster.
Key points
- Most respondents reported their highest-density racks in the 10-19 kW range year over year.
- In 2020, 71% reported a modal server rack density below 10 kW; only 16% widely deployed 20 kW or more.
- Mean density was calculated after excluding respondents above 30 kW as outliers.
- About half of organizations said their average density was increasing.
- Virtualization, containers and slowing Moore's law push utilization and per-rack power upward.
- The general shift to 20 kW racks has not happened; dense loads sit in a few hyperscale, HPC and specialist sites.
- Highest, mean and modal rack density are distinct planning metrics.
Using it in design
- Ask users for modal and peak rack density separately, not just the average, and size cooling and power for the peak cluster.
- Use the 2020 baseline (modal below 10 kW) as a sanity check when a legacy enterprise template is selected.
- Do not treat average density alone as sufficient for planning.
Monthly newsletter · free
Keep your reading list current
Once a month: new library sources, changes to Turkish regulations and upcoming data centre events.
SoSo CAD
Check cooling capacity alongside your design
Review zone heat loads, available capacity and the capacity balance after the largest unit is lost in SoSo CAD.
Request a demo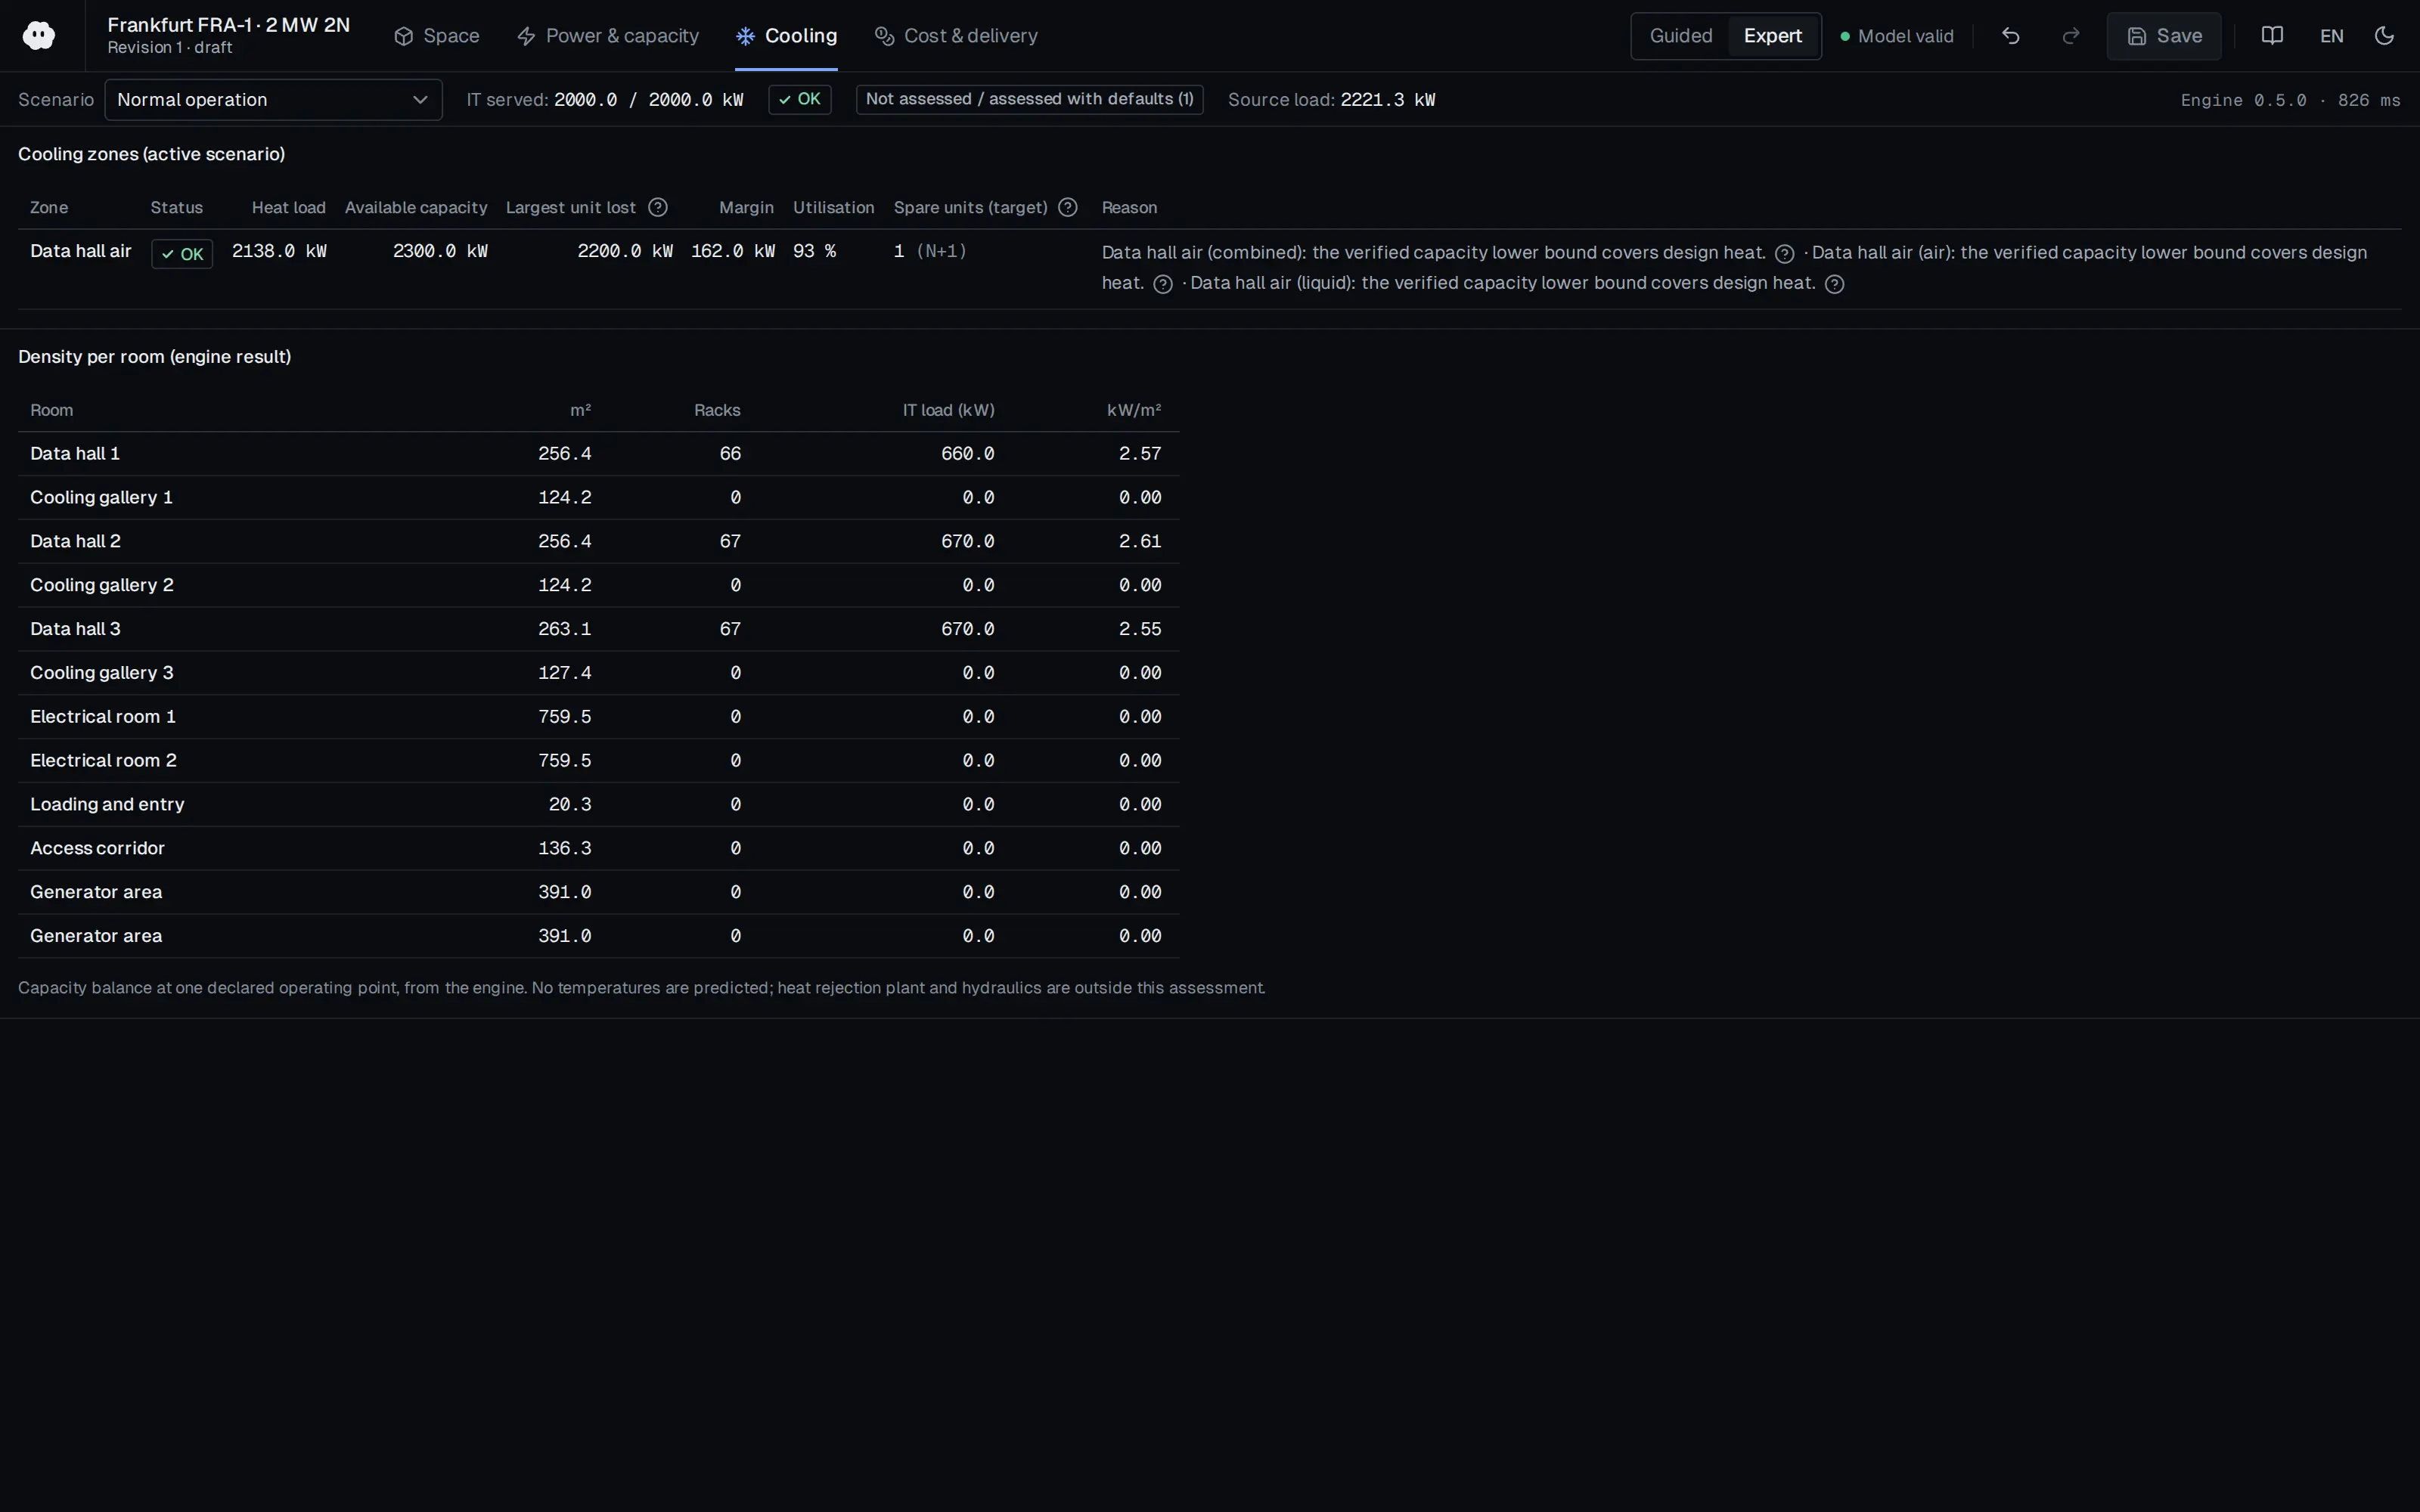
Who should read it
Design engineers and capacity planners sizing power and cooling by rack density.
Publication details
- Authors
- Andy Lawrence
- Publisher
- Uptime Institute Journal
- Year
- 2020
- Document language
- English
- Source type
- Industry body
- Access
- Free to read
- Licence
- Copyright retained; citation only — the publisher’s terms apply to the original document
Citation
Andy Lawrence (2020). Rack Density is Rising (Andy Lawrence). Uptime Institute Journal. https://journal.uptimeinstitute.com/rack-density-is-rising/
All content and rights belong to the respective authors and publishers. SoSo CAD provides only the citation, its own summary and a link to the source, and is not responsible for the sources' content.
Related sources
All sources on this topic
Open Compute Project Foundation 2020
Colocation Facility Guidelines for Deployment of Open Racks, Revision 4.0 (15 December 2020)
Check the delivery route against rack height plus 0.5 m, door and corridor widths, and the lift capacity, before agreeing to host or design for Open Racks.
- Maximum rack density is at least 8 kW (Acceptable) or 12 kW (Optimum); cold aisle width is at least 1,200 mm or 1,500 mm.
Schneider Electric 2026
How 6 AI Attributes Change Data Center Design
Add an AI cluster design profile with rack defaults of 750x1,200 mm, 48U, static 2,270 kg and dynamic 1,600 kg.
- GPU TDP trend: V100 300 W, A100 400 W, H100 700 W, B200 1,000 W, B300 1,400 W.
Vertiv 2026
Transforming Colocation Facilities to Meet Demand for AI Compute
Give the rack/pod model a liquid fraction (default about 70% for direct-to-chip) so residual air load is computed automatically.
- Average multi-node AI pod density is projected to rise from 40-100 kW to 100-250 kW.
7x24 Exchange Magazine 2025
Rack Densities Classification in the Age of AI (Jorge A. Gil, Adriana Araujo)
Adopt these category codes (LD...EHD) as a rack density class derived automatically from kW/rack.
- The lower bound for power-per-unit utilization is 85% to limit efficiency loss in operation.
Huawei Digital Power 2025
Huawei AI Data Center Reference Design
Import RD 01-21 as parametric AI-hall templates (rack kW, racks per module, module kW, redundancy of fan walls/TMUs/towers, generator and transformer counts) and as golden test cases for capacity math.
- Power distribution supports 2N, DR and BR architectures.
arXiv preprint (Microsoft Azure Research / University of Illinois) 2025
TAPAS: Thermal- and Power-Aware Scheduling for LLM Inference in Cloud Platforms
Couple thermal and power headroom in the design tool: show how inlet temperature rise with outdoor conditions (for economiser or adiabatic systems) erodes GPU thermal margin and can trigger throttling.
- GPU temperature must stay below a threshold (for example 85 C) beyond which hardware throttles computation.