
The water use of data center workloads: A review and assessment of key determinants
Resources, Conservation and Recycling (Elsevier) · Nuoa Lei, Jun Lu et al.
A review by LBNL and UCSB authors of water use per computing workload, concluding that there is no single recipe.
On this page
Overview
This article is a review and assessment by LBNL and UCSB authors of water use per computing workload. It was published in Resources, Conservation and Recycling, volume 219 (2025). The study treats water use per workload as two components: on-site cooling water and grid-related water. The study matters for treating data centre water use at workload level and in connection with electricity generation, not only as a cooling matter. This wider view carries water consumption beyond the facility boundary.
The article ranks the factors that drive litres per workload and estimates achievable minima under site constraints. The ranked determinants are server efficiency, grid water factor, utilization, cooling type, infrastructure efficiency, climate zone, inactive servers and refresh cycle. The headline findings show how wide the variability is: workload-level water use varies by more than 10,000-fold; water per kWh of server electricity varies over 1,000-fold, and server workload efficiency about 10-fold. The conclusion is that there is no single recipe.
The article is a paid journal publication and only the record's abstract-level information was used here; the full text was not read. Method details and the numeric weights of the determinants are therefore not given here, and the original article should be consulted for them. This ranking helps set design and operating priorities by showing which factors affect water per workload most. Achievable minima, meanwhile, vary with site constraints.
Key points
- Workload-level water use varies by more than 10,000-fold.
- Water per kWh of server electricity varies over 1,000-fold; server workload efficiency about 10-fold.
- Ranked determinants: server efficiency, grid water factor, utilization, cooling type, infrastructure efficiency, climate zone, inactive servers, refresh cycle.
- Water use combines on-site cooling water and grid-related water.
- The conclusion is that there is no single recipe.
- Published in Resources, Conservation and Recycling vol. 219 (2025).
Using it in design
- In the water module, report both on-site WUE and grid (source) water using regional factors.
- Let users see the sensitivity to cooling type and climate.
- Avoid presenting a single best cooling choice.
Monthly newsletter · free
Keep your reading list current
Once a month: new library sources, changes to Turkish regulations and upcoming data centre events.
SoSo CAD
Check cooling capacity alongside your design
Review zone heat loads, available capacity and the capacity balance after the largest unit is lost in SoSo CAD.
Request a demo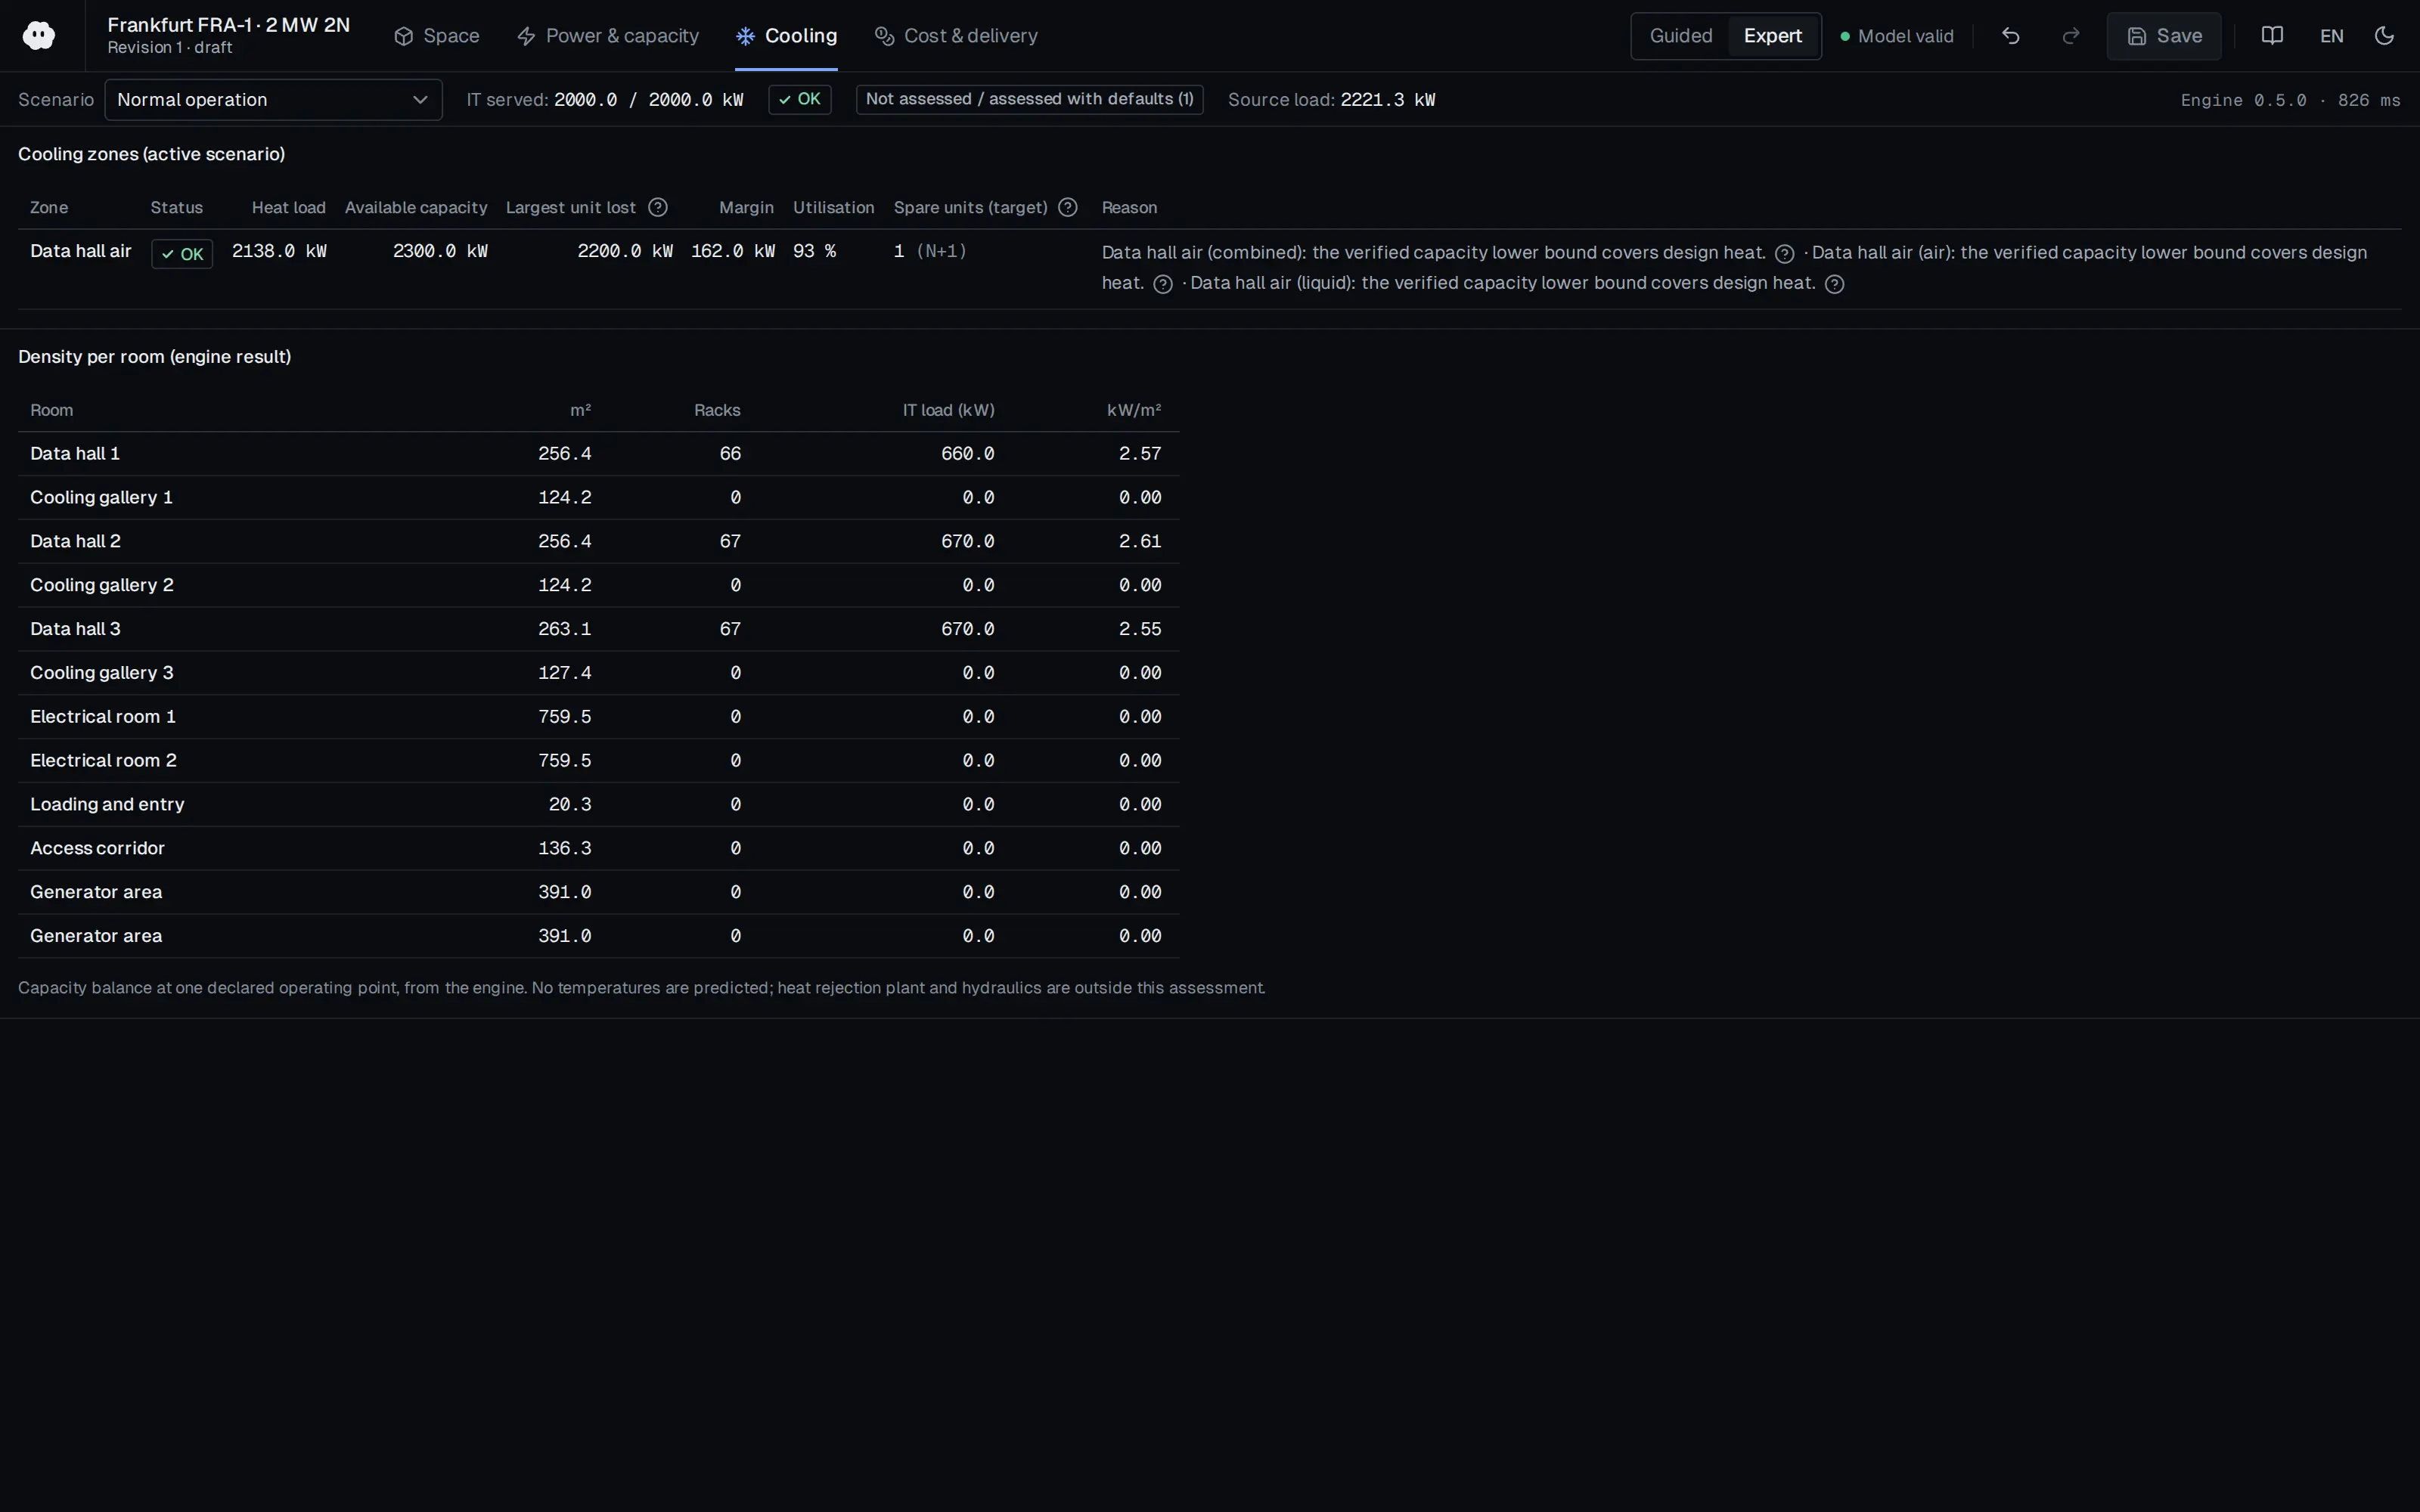
Who should read it
Designers and researchers weighing water use, sustainability and cooling type together.
Related standards
- ISO/IEC 30134-9
Publication details
- Authors
- Nuoa Lei; Jun Lu; Arman Shehabi; Eric R. Masanet
- Publisher
- Resources, Conservation and Recycling (Elsevier)
- Year
- 2025
- Document language
- English
- Source type
- Scientific
- Access
- Citation only
- Licence
- Copyright retained; citation only — the publisher’s terms apply to the original document
Original licence note
Journal article (publisher copyright); cited only.
Citation
Nuoa Lei; Jun Lu; Arman Shehabi; Eric R. Masanet (2025). The water use of data center workloads: A review and assessment of key determinants. Resources, Conservation and Recycling (Elsevier). https://doi.org/10.1016/j.resconrec.2025.108310
Events on this subject
Browse the events calendarAll content and rights belong to the respective authors and publishers. SoSo CAD provides only the citation, its own summary and a link to the source, and is not responsible for the sources' content.
Related sources
All sources on this topic
Open Compute Project Foundation 2026
Guidelines: Impact of Strategies on Data Center Energy Consumption, Carbon Footprint, and Water Consumption (March 2026)
Evaluate cooling and siting options on energy, carbon, site water and water scarcity together, not on PUE or WUE alone.
- Same example: emissions fall from 3,500 to 2,700 t CO2/yr with the carbon factor of 0.26 kg CO2/kWh.
Journal of Cleaner Production (Elsevier BV) 2025
Sustainable AI infrastructure: A scenario-based forecast of water footprint under uncertainty
In water-footprint planning, calculate on-site (WUE), off-site electricity (PUE × EWIF) and embodied hardware water as separate items.
- Under BAU, water demand rises nearly sevenfold between 2030 and 2050; improvements in WUE, EWIF and embodied water could cut 2050 use by up to 95% against BAU.
Open Compute Project Foundation 2023
Data Centers Heat Reuse 101
A heat-reuse module should report recoverable heat (kW) and its temperature band by cooling technology (air, RDHx, DLC/immersion) and suggest compatible heat-host categories.
- Containerised/modular data centres can exceed 0.5 MW, a significant heat quantity for many local applications.
U.S. DOE FEMP / NREL 2019
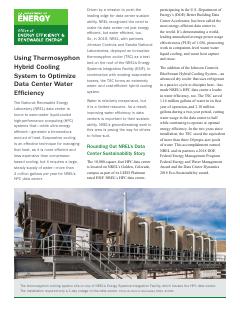
Using Thermosyphon Hybrid Cooling System to Optimize Data Center Water Efficiency (DOE/GO-102019-5172, May 2019)
Arrange the heat-rejection hierarchy as in the scheme: heat reuse first, then dry cooling, evaporative towers last; write the control logic in that order.
- Installing the TSC required only a 1-day data center outage.
Sustainability (MDPI AG) 2015
The Water Footprint of Data Centers
Compare HVAC options not only by on-site water use but by total water footprint including the grid's water intensity (WUEsource); the ranking can flip with the grid.
- Outbound data traffic carries a water footprint of 1-205 litres per gigabyte; the high end is close to the 214 L footprint of 1 kg of tomatoes.
Google 2026
Google Data Centers — Operating sustainably (energy and water)
In the cooling-selection UX present an explicit energy-versus-water trade-off (PUE versus WUE) per site, with a water-stress input (for example a WRI Aqueduct category).
- 87% of 2025 freshwater withdrawal from sources at low or medium depletion/scarcity risk.