
The Water Footprint of Data Centers
Sustainability (MDPI AG) · Bora Ristic, Kaveh Madani et al.
An early water-footprint (WF) accounting of data centres from Imperial College London that adds the water embedded in purchased electricity (WFsource) to on-site HVAC water use: indirect (electricity) water normally dominates.
CC BY 4.0 — share with attribution
On this page
Overview
As the internet and ICT diffuse rapidly, data-centre energy efficiency has been researched extensively but water footprint has received little to no attention. The paper conducts a preliminary WF accounting for cooling and energy consumption, using an Apple facility dataset and a comparison of HVAC options for a Phoenix data centre. The global data-centre water footprint (HVAC plus energy) is estimated at 767-147,810 million m³ per year, giving a WUEsource of 1047 to 151,061 m³/TJ; this is much higher than the 787 m³/TJ reported by Sharma et al., because WF accounting includes the water embedded in electricity generation.
Outbound data traffic carries a water footprint of 1-205 litres per gigabyte; the high end is close to the 214 L footprint of 1 kg of tomatoes. The indirect water footprint (electricity) is typically much larger than the direct footprint, so the authors say the first priority for cutting data-centre water footprint should be air-side economisation and energy efficiency.
The result is that the HVAC option with the lowest on-site water use is not always the one with the lowest total footprint; the answer flips with the grid's water intensity. Where WFsource is high, HVAC systems that use some water directly can cut the total footprint (Phoenix case); where WFsource is very low, moving away from direct-water HVAC cuts it. The authors name three key uncertainties for data-centre water-footprint work: the water footprint of electricity, psychrometrics (climate) and the water footprint of the HVAC system.
Limits: the authors stress that their global numbers carry very large uncertainty; values are more indicative of the uncertainties involved than a definite quantification. They call for standard WF/WUE reporting.
Key points
- Global data-centre water footprint (HVAC plus energy) is estimated at 767-147,810 million m³ per year, giving a WUEsource of 1047 to 151,061 m³/TJ.
- The WUEsource range is much higher than the 787 m³/TJ reported by Sharma et al., because WF accounting includes the water embedded in electricity generation.
- Outbound data traffic carries a water footprint of 1-205 litres per gigabyte; the high end is close to the 214 L footprint of 1 kg of tomatoes.
- The indirect water footprint (electricity) is typically much larger than the direct footprint, so the first priority should be air-side economisation and energy efficiency.
- Where WFsource is high, HVAC systems that use some water directly can cut the total footprint (Phoenix case); where WFsource is very low, moving away from direct-water HVAC cuts it.
- Three key uncertainties: the water footprint of electricity, psychrometrics (climate) and the water footprint of the HVAC system.
Using it in design
- Compare HVAC options not only by on-site water use but by total water footprint including the grid's water intensity (WUEsource); the ranking can flip with the grid.
- Consider air-side economisation and energy efficiency as the first step to cut water footprint, because electricity-related indirect water usually dominates.
- Report water-footprint results as ranges with the uncertainties of electricity water intensity, climate and HVAC water footprint.
Monthly newsletter · free
Keep your reading list current
Once a month: new library sources, changes to Turkish regulations and upcoming data centre events.
SoSo CAD
Check cooling capacity alongside your design
Review zone heat loads, available capacity and the capacity balance after the largest unit is lost in SoSo CAD.
Request a demo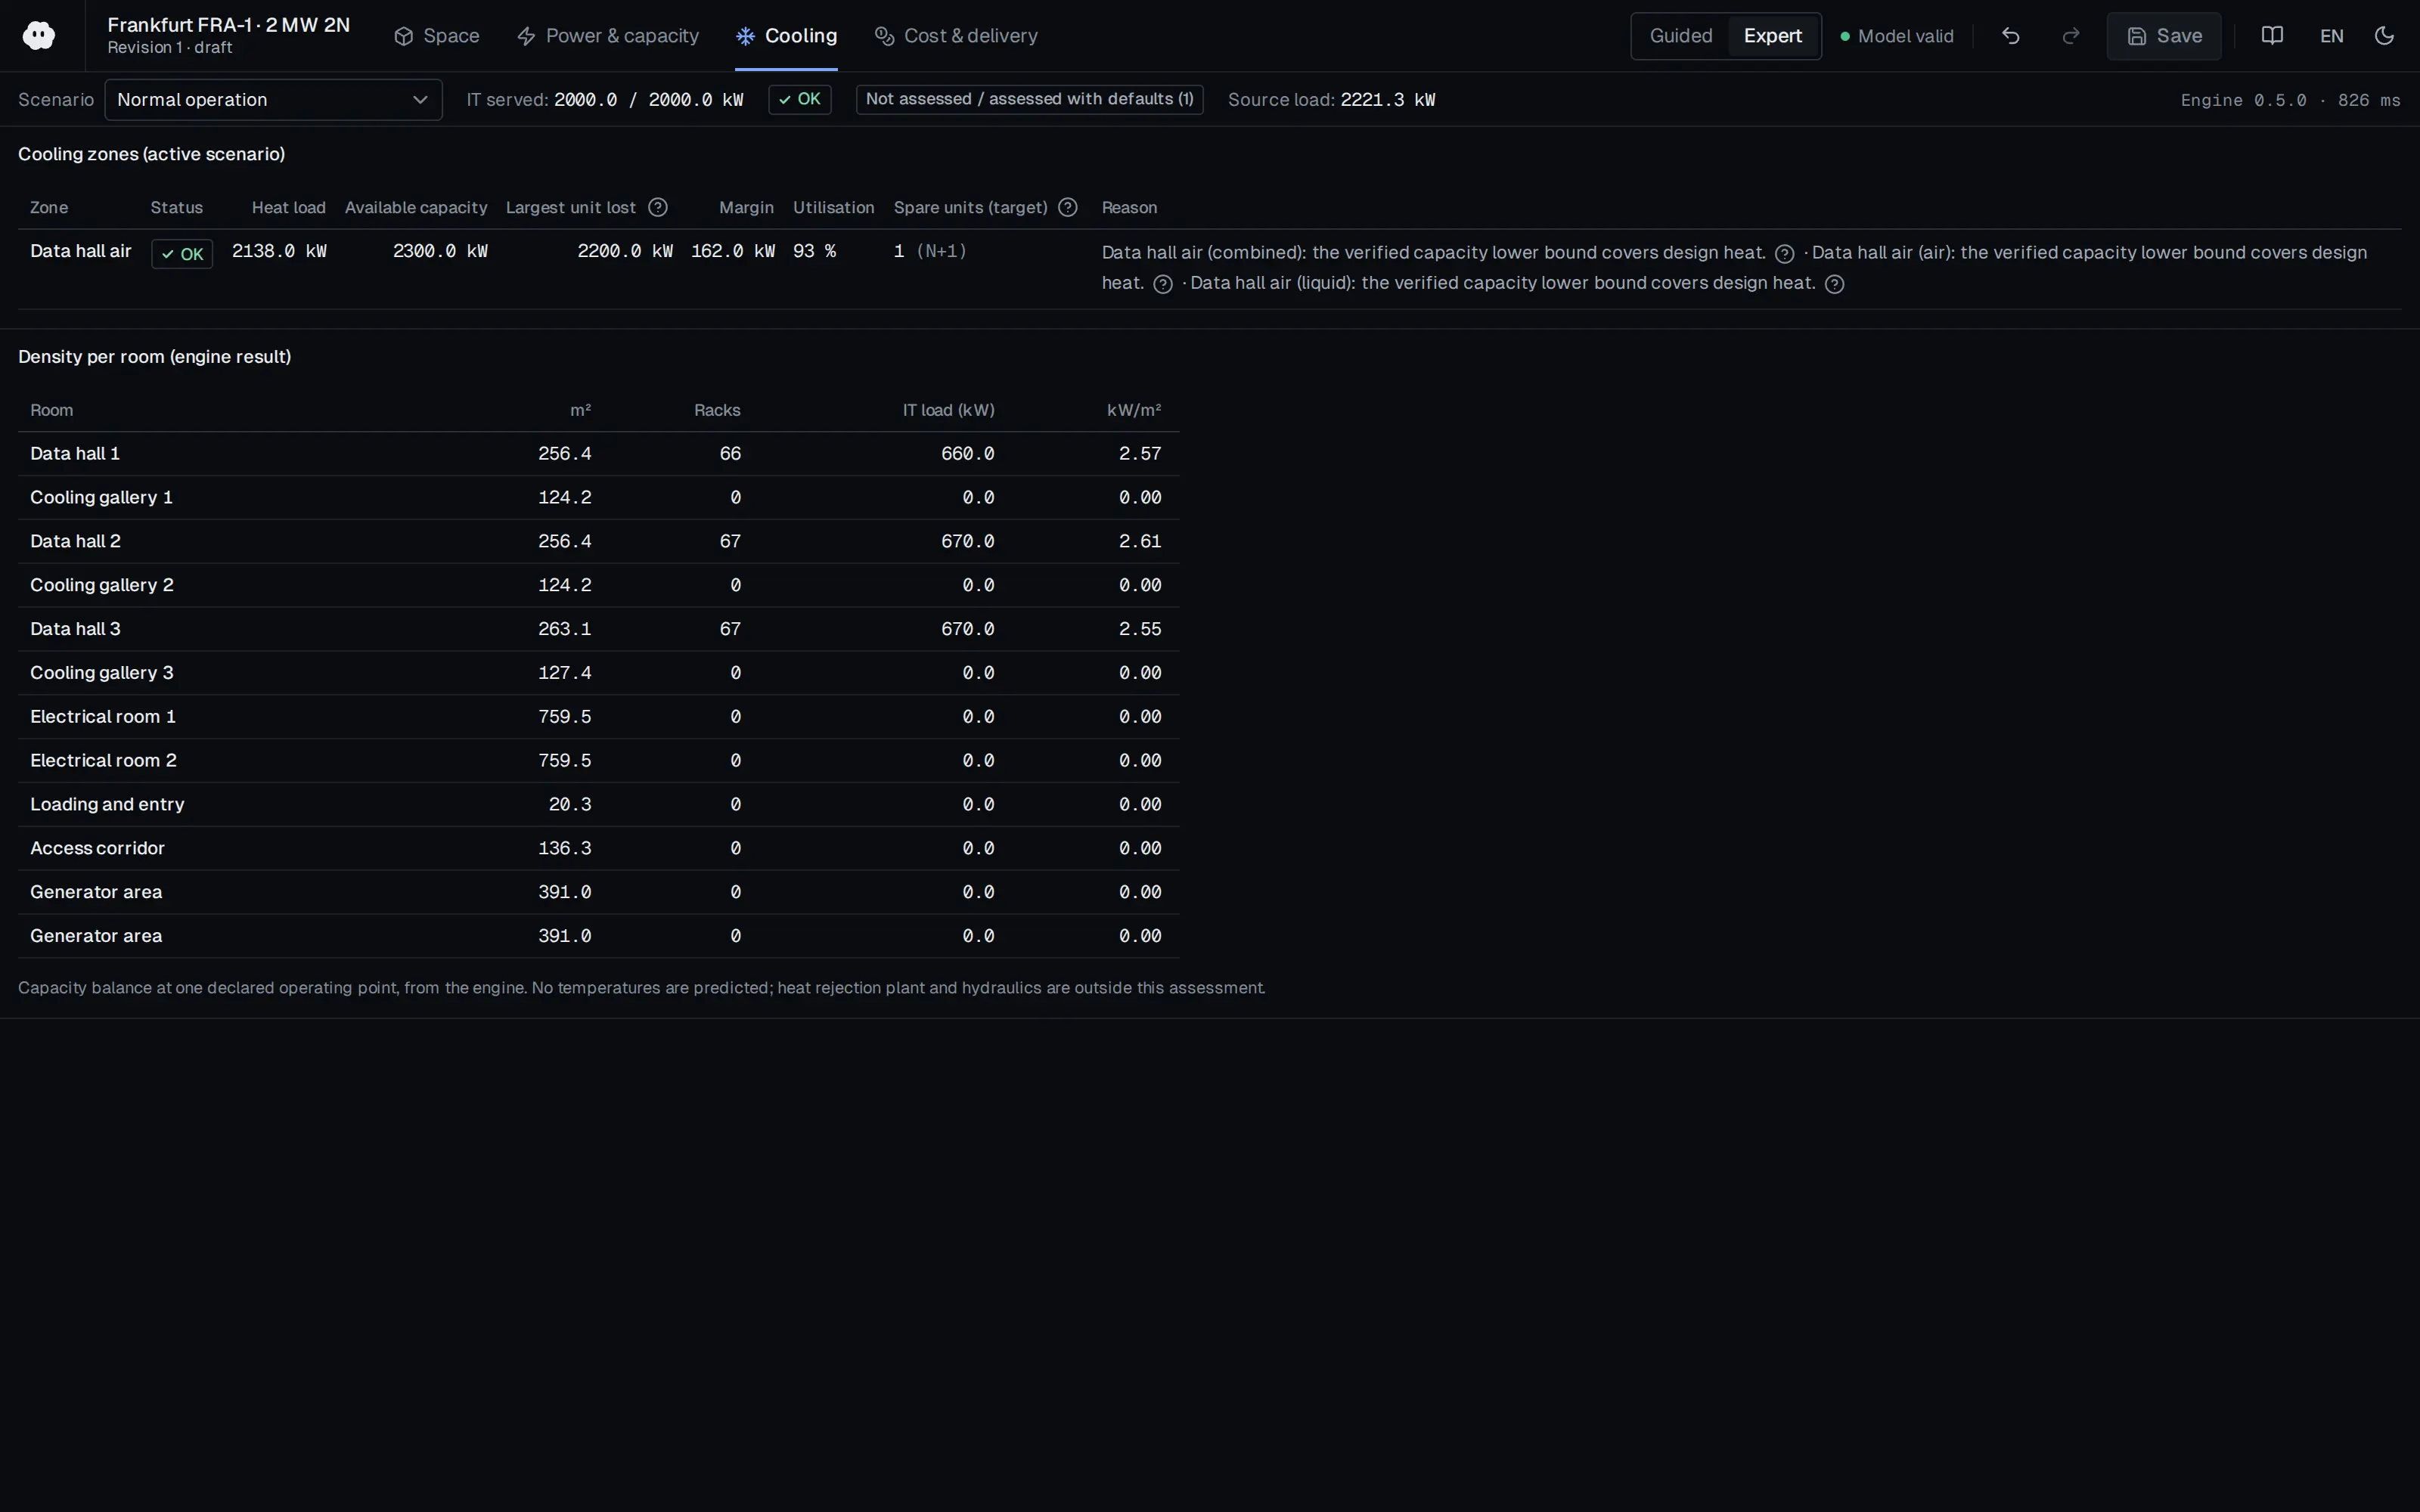
Who should read it
Designers and sustainability managers doing data-centre siting, cooling selection and water-footprint reporting.
Document contents
- 1. Introduction
- 2. Water Footprint for Measuring Water Use Efficiency
- 3. Data Center Structure and Water Footprint of Its Components (3.1 IT Equipment and Uninterruptible Power Supply, 3.2 Direct WF—HVAC, 3.3 Psychrometrics: Temperature and Humidity, 3.4 Indirect WF—Energy Source)
- 4. Uncertainties (4.1 Uncertain WFs of HVAC Systems, 4.2 Water Footprint of Data Centres and Data Centre Outbound Traffic)
- 5. Caveats for Policy and Innovation Recommendations
- 6. Conclusions
Related standards
- ISO/IEC 30134-9 (WUE)
- The Green Grid WP35 (WUE)
Read the document
ristic-water-footprint-data-centers-2015.pdf
CC BY 4.0 — share with attribution
The document is provided unaltered because its licence permits redistribution.
Publication details
- Authors
- Bora Ristic; Kaveh Madani; Zen Makuch
- Publisher
- Sustainability (MDPI AG)
- Year
- 2015
- Volume
- 7
- Issue
- 8
- Pages
- 11260-11284
- Document language
- English
- Source type
- Scientific
- Access
- Open licence — downloadable
- Licence
- CC BY 4.0 — share with attribution
- Licence evidence
- www.mdpi.com
Original licence note
p.1 states the article is open access under the Creative Commons Attribution licence (CC BY 4.0).
Citation
Bora Ristic; Kaveh Madani; Zen Makuch (2015). The Water Footprint of Data Centers. Sustainability (MDPI AG). 7(8), 11260-11284. https://doi.org/10.3390/su70811260
Events on this subject
Browse the events calendarAll content and rights belong to the respective authors and publishers. SoSo CAD provides only the citation, its own summary and a link to the source, and is not responsible for the sources' content.
Related sources
All sources on this topic
Open Compute Project Foundation 2026
Guidelines: Impact of Strategies on Data Center Energy Consumption, Carbon Footprint, and Water Consumption (March 2026)
Evaluate cooling and siting options on energy, carbon, site water and water scarcity together, not on PUE or WUE alone.
- Same example: emissions fall from 3,500 to 2,700 t CO2/yr with the carbon factor of 0.26 kg CO2/kWh.
Journal of Cleaner Production (Elsevier BV) 2025
Sustainable AI infrastructure: A scenario-based forecast of water footprint under uncertainty
In water-footprint planning, calculate on-site (WUE), off-site electricity (PUE × EWIF) and embodied hardware water as separate items.
- Under BAU, water demand rises nearly sevenfold between 2030 and 2050; improvements in WUE, EWIF and embodied water could cut 2050 use by up to 95% against BAU.
Open Compute Project Foundation 2023
Data Centers Heat Reuse 101
A heat-reuse module should report recoverable heat (kW) and its temperature band by cooling technology (air, RDHx, DLC/immersion) and suggest compatible heat-host categories.
- Containerised/modular data centres can exceed 0.5 MW, a significant heat quantity for many local applications.
U.S. DOE FEMP / NREL 2019
Using Thermosyphon Hybrid Cooling System to Optimize Data Center Water Efficiency (DOE/GO-102019-5172, May 2019)
Arrange the heat-rejection hierarchy as in the scheme: heat reuse first, then dry cooling, evaporative towers last; write the control logic in that order.
- Installing the TSC required only a 1-day data center outage.
Google 2026
Google Data Centers — Operating sustainably (energy and water)
In the cooling-selection UX present an explicit energy-versus-water trade-off (PUE versus WUE) per site, with a water-stress input (for example a WRI Aqueduct category).
- 87% of 2025 freshwater withdrawal from sources at low or medium depletion/scarcity risk.
Schneider Electric 2026
Water Usage at AI Scale: Insights from a 100 MW Comparative Analysis
Compute and display WUE (L/kWh IT) next to PUE for every cooling design.
- Dallas WUE falls from 0.42 to 0.22 L/kWh; Paris from 0.12 to 0.06 L/kWh.