
The environmental footprint of data centers in the United States
Environmental Research Letters (IOP Publishing) · Md Abu Bakar Siddik, Arman Shehabi et al.
A bottom-up, subbasin-level estimate of the direct and indirect water footprint, water-scarcity footprint and carbon footprint of US data centres for 2018: about three-quarters of the operational water footprint is indirect (electricity), while direct use skews toward water-stressed basins.
CC BY 4.0 — share with attribution
On this page
Overview
Against a background in which data centres account for about 1.8% of US electricity use and use water both directly for cooling and indirectly for electricity generation, the study calculates the first spatially detailed carbon and water footprints. Servers are mapped to locations and power-plant supply, and an ISO-style water scarcity weighting is applied. A direct cooling water requirement of 1.8 m³/MWh is used to estimate on-site water use when facility data are lacking.
Total annual operational water footprint of US data centres in 2018 was estimated at 5.13 × 10^8 m³; about three-quarters is indirect, with 3.83 × 10^8 m³ attributed to electricity generation. On-site direct water consumption was 1.30 × 10^8 m³, which puts data centres among the top-ten water-consuming industrial or commercial industries in the US. Nationally, 1 MWh of data-centre energy use requires 7.1 m³ of water, with spatial variation from 1.8 to 105.9 m³/MWh.
The water scarcity footprint is 1.29 × 10^9 m³ US-eq (17.9 m³ US-eq/MWh), more than double the volumetric intensity of 7.1 m³/MWh, so data centres draw disproportionately on stressed watersheds. Only one-fourth of the volumetric water footprint is on-site use, but more than 40% of the water scarcity footprint comes from direct consumption. Depending on location, water intensity ranges from 1.8 to 106 m³/MWh, water scarcity intensity from 0.5 to 305 m³ US-eq/MWh and carbon intensity from 0.02 to 1 t CO2-eq/MWh. One-fifth of servers draw their direct water footprint from moderately to highly water-stressed watersheds, and nearly half are fully or partially powered by plants in water-stressed regions.
Limits: this is a 2018 estimate, and the bottom-up model rests on assumptions about mapping servers to locations and plant supply, using a generic 1.8 m³/MWh where facility data is missing. Siting scenarios show large cuts in water-scarcity and carbon footprints if new servers go into favourable subbasins.
Key points
- Total annual operational water footprint of US data centres in 2018 was estimated at 5.13 × 10^8 m³; about three-quarters is indirect, with 3.83 × 10^8 m³ attributed to electricity generation.
- Nationally, 1 MWh of data-centre energy use requires 7.1 m³ of water, with spatial variation from 1.8 to 105.9 m³/MWh.
- On-site direct water consumption in 2018 was 1.30 × 10^8 m³, placing data centres among the top-ten water-consuming industrial or commercial industries in the US.
- The water scarcity footprint is 1.29 × 10^9 m³ US-eq (17.9 m³ US-eq/MWh), more than double the volumetric intensity of 7.1 m³/MWh.
- Only one-fourth of the volumetric water footprint is on-site use, but more than 40% of the water scarcity footprint comes from direct consumption.
- Depending on location, water intensity ranges from 1.8 to 106 m³/MWh, water scarcity intensity from 0.5 to 305 m³ US-eq/MWh and carbon intensity from 0.02 to 1 t CO2-eq/MWh.
- A direct cooling water requirement of 1.8 m³/MWh is used to estimate on-site water use when facility data are lacking.
Using it in design
- In data-centre siting, assess the water scarcity footprint (m³ US-eq/MWh) and carbon intensity together with volumetric water intensity; they vary from 0.5 to 305 m³ US-eq/MWh by location.
- Report water footprint not only as on-site use but together with the indirect share from electricity generation (about three-quarters).
- Compare scenarios placing new capacity in favourable subbasins and in grids with low water and carbon intensity.
Monthly newsletter · free
Keep your reading list current
Once a month: new library sources, changes to Turkish regulations and upcoming data centre events.
SoSo CAD
Check cooling capacity alongside your design
Review zone heat loads, available capacity and the capacity balance after the largest unit is lost in SoSo CAD.
Request a demo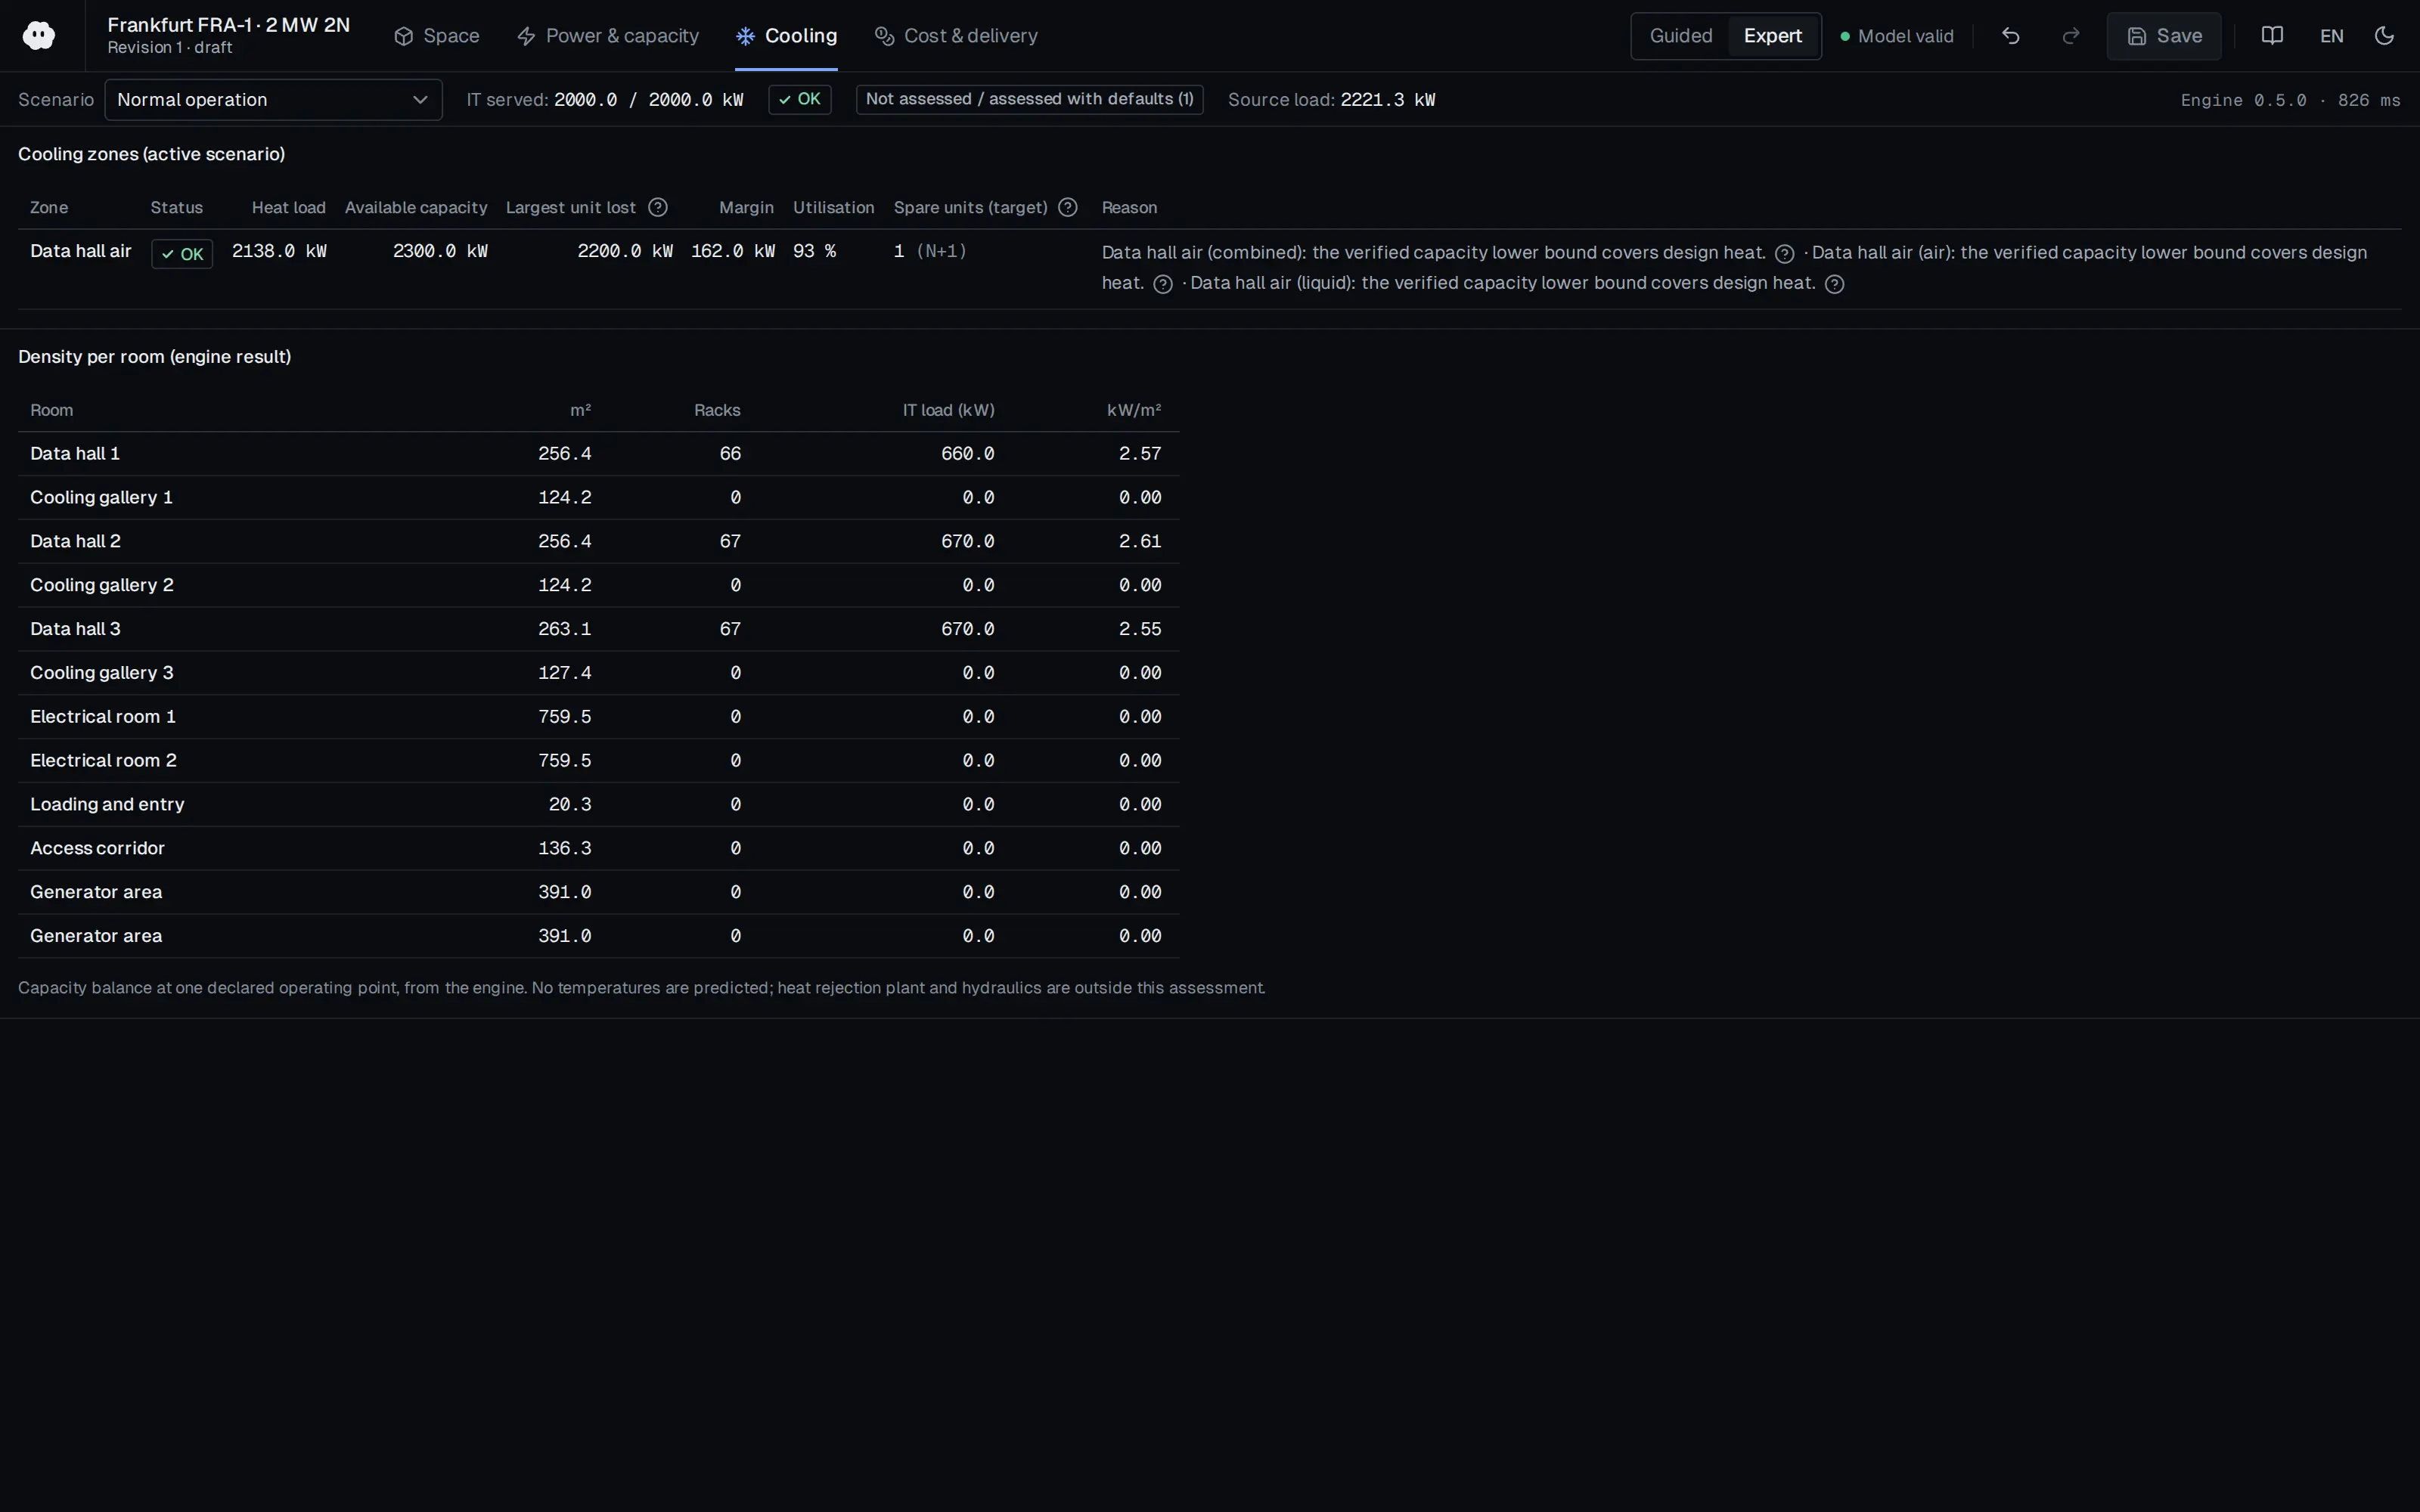
Who should read it
Planners and policy specialists doing data-centre siting, sustainability and water-risk assessment.
Document contents
- 1. Introduction
- 2. Methods (2.1 Data center location and energy use, 2.2 Electricity generation, water consumption, 2.3 Water consumption and GHG emissions, 2.4 Water scarcity footprint)
- 3. Results (3.1 The water footprint of data centers, 3.2 Reliance of data centers on scarce water, 3.3 GHG emissions attributed to data centers, 3.4 Where to locate data centers to minimize water)
- 4. Discussion and conclusion
Related standards
- ISO 14046 (water footprint)
Read the document
siddik-us-data-center-environmental-footprint-2021.pdf
CC BY 4.0 — share with attribution
The document is provided unaltered because its licence permits redistribution.
Publication details
- Authors
- Md Abu Bakar Siddik; Arman Shehabi; Landon Marston
- Publisher
- Environmental Research Letters (IOP Publishing)
- Year
- 2021
- Volume
- 16
- Issue
- 6
- Pages
- 064017
- Document language
- English
- Source type
- Scientific
- Access
- Open licence — downloadable
- Licence
- CC BY 4.0 — share with attribution
- Licence evidence
- iopscience.iop.org
Original licence note
Published IOP version (eScholarship copy with a cover page). Article page 1 states: 'Original Content from this work may be used under the terms of the Creative Commons Attribution 4.0 licence.'
Citation
Md Abu Bakar Siddik; Arman Shehabi; Landon Marston (2021). The environmental footprint of data centers in the United States. Environmental Research Letters (IOP Publishing). 16(6), 064017. https://doi.org/10.1088/1748-9326/abfba1
Events on this subject
Browse the events calendarAll content and rights belong to the respective authors and publishers. SoSo CAD provides only the citation, its own summary and a link to the source, and is not responsible for the sources' content.
Related sources
All sources on this topic
Frontiers in Environmental Science (Frontiers Media SA) 2026
Net sustainability assessment of AI-driven data centers in the GCC: an MCDA approach framework
In AI data-centre investment assessment in hot, arid regions, weigh carbon, water, social and governance criteria together with explicit weights (0.40/0.25/0.20/0.15); indirect water (desalination energy) was about 0.68 times direct cooling water.
- In the extended boundary, embodied carbon adds 15-25% to the operational footprint.
arXiv preprint (cs.CY; formatted for ACM e-Energy '26) 2026
Beyond PUE: A Local-Impact Audit Framework for Data Center Environmental Accountability
In siting and community-acceptance files, present PUE, WUE and CUE together with regional water stress, grid headroom and verification maturity (L0-L4); back project commitments with contractual limits and independent metering (L2-L3).
- Compliance gate: any unresolved major regulatory violation caps the composite score at a ceiling of 40 (suggested, subject to calibration).
Open Compute Project Foundation 2026
Guidelines: Impact of Strategies on Data Center Energy Consumption, Carbon Footprint, and Water Consumption (March 2026)
Evaluate cooling and siting options on energy, carbon, site water and water scarcity together, not on PUE or WUE alone.
- Same example: emissions fall from 3,500 to 2,700 t CO2/yr with the carbon factor of 0.26 kg CO2/kWh.
European Commission, DG CNECT (EY, Borderstep Institute, AIT, RP legalitax) 2025
Synergies between Data Centres and Energy Systems - Final Report (European Commission, DG CNECT)
When choosing cooling architecture assess waste heat temperature early: liquid cooling gives higher temperatures, even air cooling can give about 30-35 C as a heat-pump source; position the heat pump for the receiving network temperature (60-80 C or 4th/5th generation).
- In the stakeholder survey, over 60% rated heat reuse technically viable today but only about 20% economically viable.
arXiv (UC Riverside / RIT / Caltech preprint) 2026
Small Bottle, Big Pipe: Quantifying and Addressing the Impact of Data Centers on Public Water Systems
Add a peak-day water demand output (annual average times peaking factor, default at least 2.2 for cooling towers, configurable up to about 6-10 for evaporative assist used only on hot days), and compare it with utility supply capacity in site screening.
- With a 10% compound annual WUE reduction, the need drops to 227-604 MGD.
Arup (Arup Foresight) 2025
Data Centre Futures: Water - Strategic design for water-conscious data centres (Issue 01)
Show WUE (L/kWh) next to PUE for every heat-rejection option.
- About 22% of data centres use liquid cooling; cooling is roughly 20% of capex and 50% of opex.