
Optimization Strategies for Underfloor Air Distribution in a Small-Scale Data Center
Buildings (MDPI AG) · Fengjiao Yu, Hongbing Chen et al.
A field-checked 6SigmaDC model of a small Beijing server room: 14.75 m × 13.75 m × 3.45 m, 68 cabinets in five rows, three 60 kW units and a 0.45 m plenum with 45% perforated panels; raised-floor height and four aisle-containment options are studied.
CC BY 4.0 — share with attribution
On this page
Overview
The study asks how underfloor air distribution in a small data centre can be optimised, given that hot and cold airflow mixing in rapidly expanding 5G-era data centres keeps the thermal environment from meeting operating requirements. The room is 14.75 m × 13.75 m × 3.45 m with three units of 6.5 m³/s each (60 kW total, 33.4 kW sensible), five cabinet rows (13-14 cabinets each), a 0.45 m raised floor and 0.6 m × 0.6 m tiles with 45% open area; design supply is 18 °C. Validation errors: tile outlet temperature about 2% on average, tile velocity 18% (12% excluding outliers), and overall averages of 9.44% for temperature and 12.6% for velocity.
At 300, 400 and 500 mm plenum heights, minimum grille flows were negative: -0.044, -0.02 and -0.024 m³/s respectively. At 700 mm the grille flow range was 0.081-0.354 m³/s and at 800 mm 0.155-0.34 m³/s. The best plenum height range is 600-800 mm, with little improvement above 800 mm. At 600 mm, maximum cabinet inlet and outlet temperatures were 19.3 °C and 34 °C and RHI was 0.9622.
RHI was 0.9622 open, 0.9710 with cold aisles closed, 0.9271 with hot aisles closed and 0.9975 with both closed; hot-aisle-only containment let supply air bypass to the unit returns, and the highest temperature reached 40.3 °C. Cold-aisle containment allowed the supply air temperature to rise from 18 °C to 20 °C, with average cabinet inlet and outlet temperatures of 18-18.4 °C and 29-30 °C.
Limits: a single small room, with a 12.6% average velocity validation error; results depend on this room's geometry and unit layout. Hot-aisle containment lowered RHI in this room, so the choice of containment type should be verified room by room.
Key points
- Room 14.75 m × 13.75 m × 3.45 m with three units of 6.5 m³/s each (60 kW total, 33.4 kW sensible), five cabinet rows (13-14 cabinets each), a 0.45 m raised floor and 0.6 m × 0.6 m tiles with 45% open area; design supply 18 °C.
- Validation errors: tile outlet temperature about 2% on average, tile velocity 18% (12% excluding outliers), overall averages of 9.44% for temperature and 12.6% for velocity.
- At 300, 400 and 500 mm plenum heights, minimum grille flows were negative: -0.044, -0.02 and -0.024 m³/s; at 700 mm the range was 0.081-0.354 m³/s and at 800 mm 0.155-0.34 m³/s.
- The best plenum height range is 600-800 mm, with little improvement above 800 mm; at 600 mm, maximum cabinet inlet and outlet temperatures were 19.3 °C and 34 °C and RHI was 0.9622.
- RHI was 0.9622 open, 0.9710 with cold aisles closed, 0.9271 with hot aisles closed and 0.9975 with both closed; hot-aisle-only containment let supply air bypass to the unit returns.
- Cold-aisle containment allowed the supply air temperature to rise from 18 °C to 20 °C.
Using it in design
- Choose a raised-floor height of at least 600 mm; at 300-500 mm some grilles had reverse (negative) flow and uneven static pressure, and gains levelled off above 800 mm.
- Prefer cold-aisle containment and consider raising supply from 18 to 20 °C; in this room hot-aisle-only containment lowered RHI because cold air bypassed to the unit returns.
- Verify plenum height and containment decisions room by room with tile airflow measurement and CFD.
Monthly newsletter · free
Keep your reading list current
Once a month: new library sources, changes to Turkish regulations and upcoming data centre events.
SoSo CAD
Check cooling capacity alongside your design
Review zone heat loads, available capacity and the capacity balance after the largest unit is lost in SoSo CAD.
Request a demo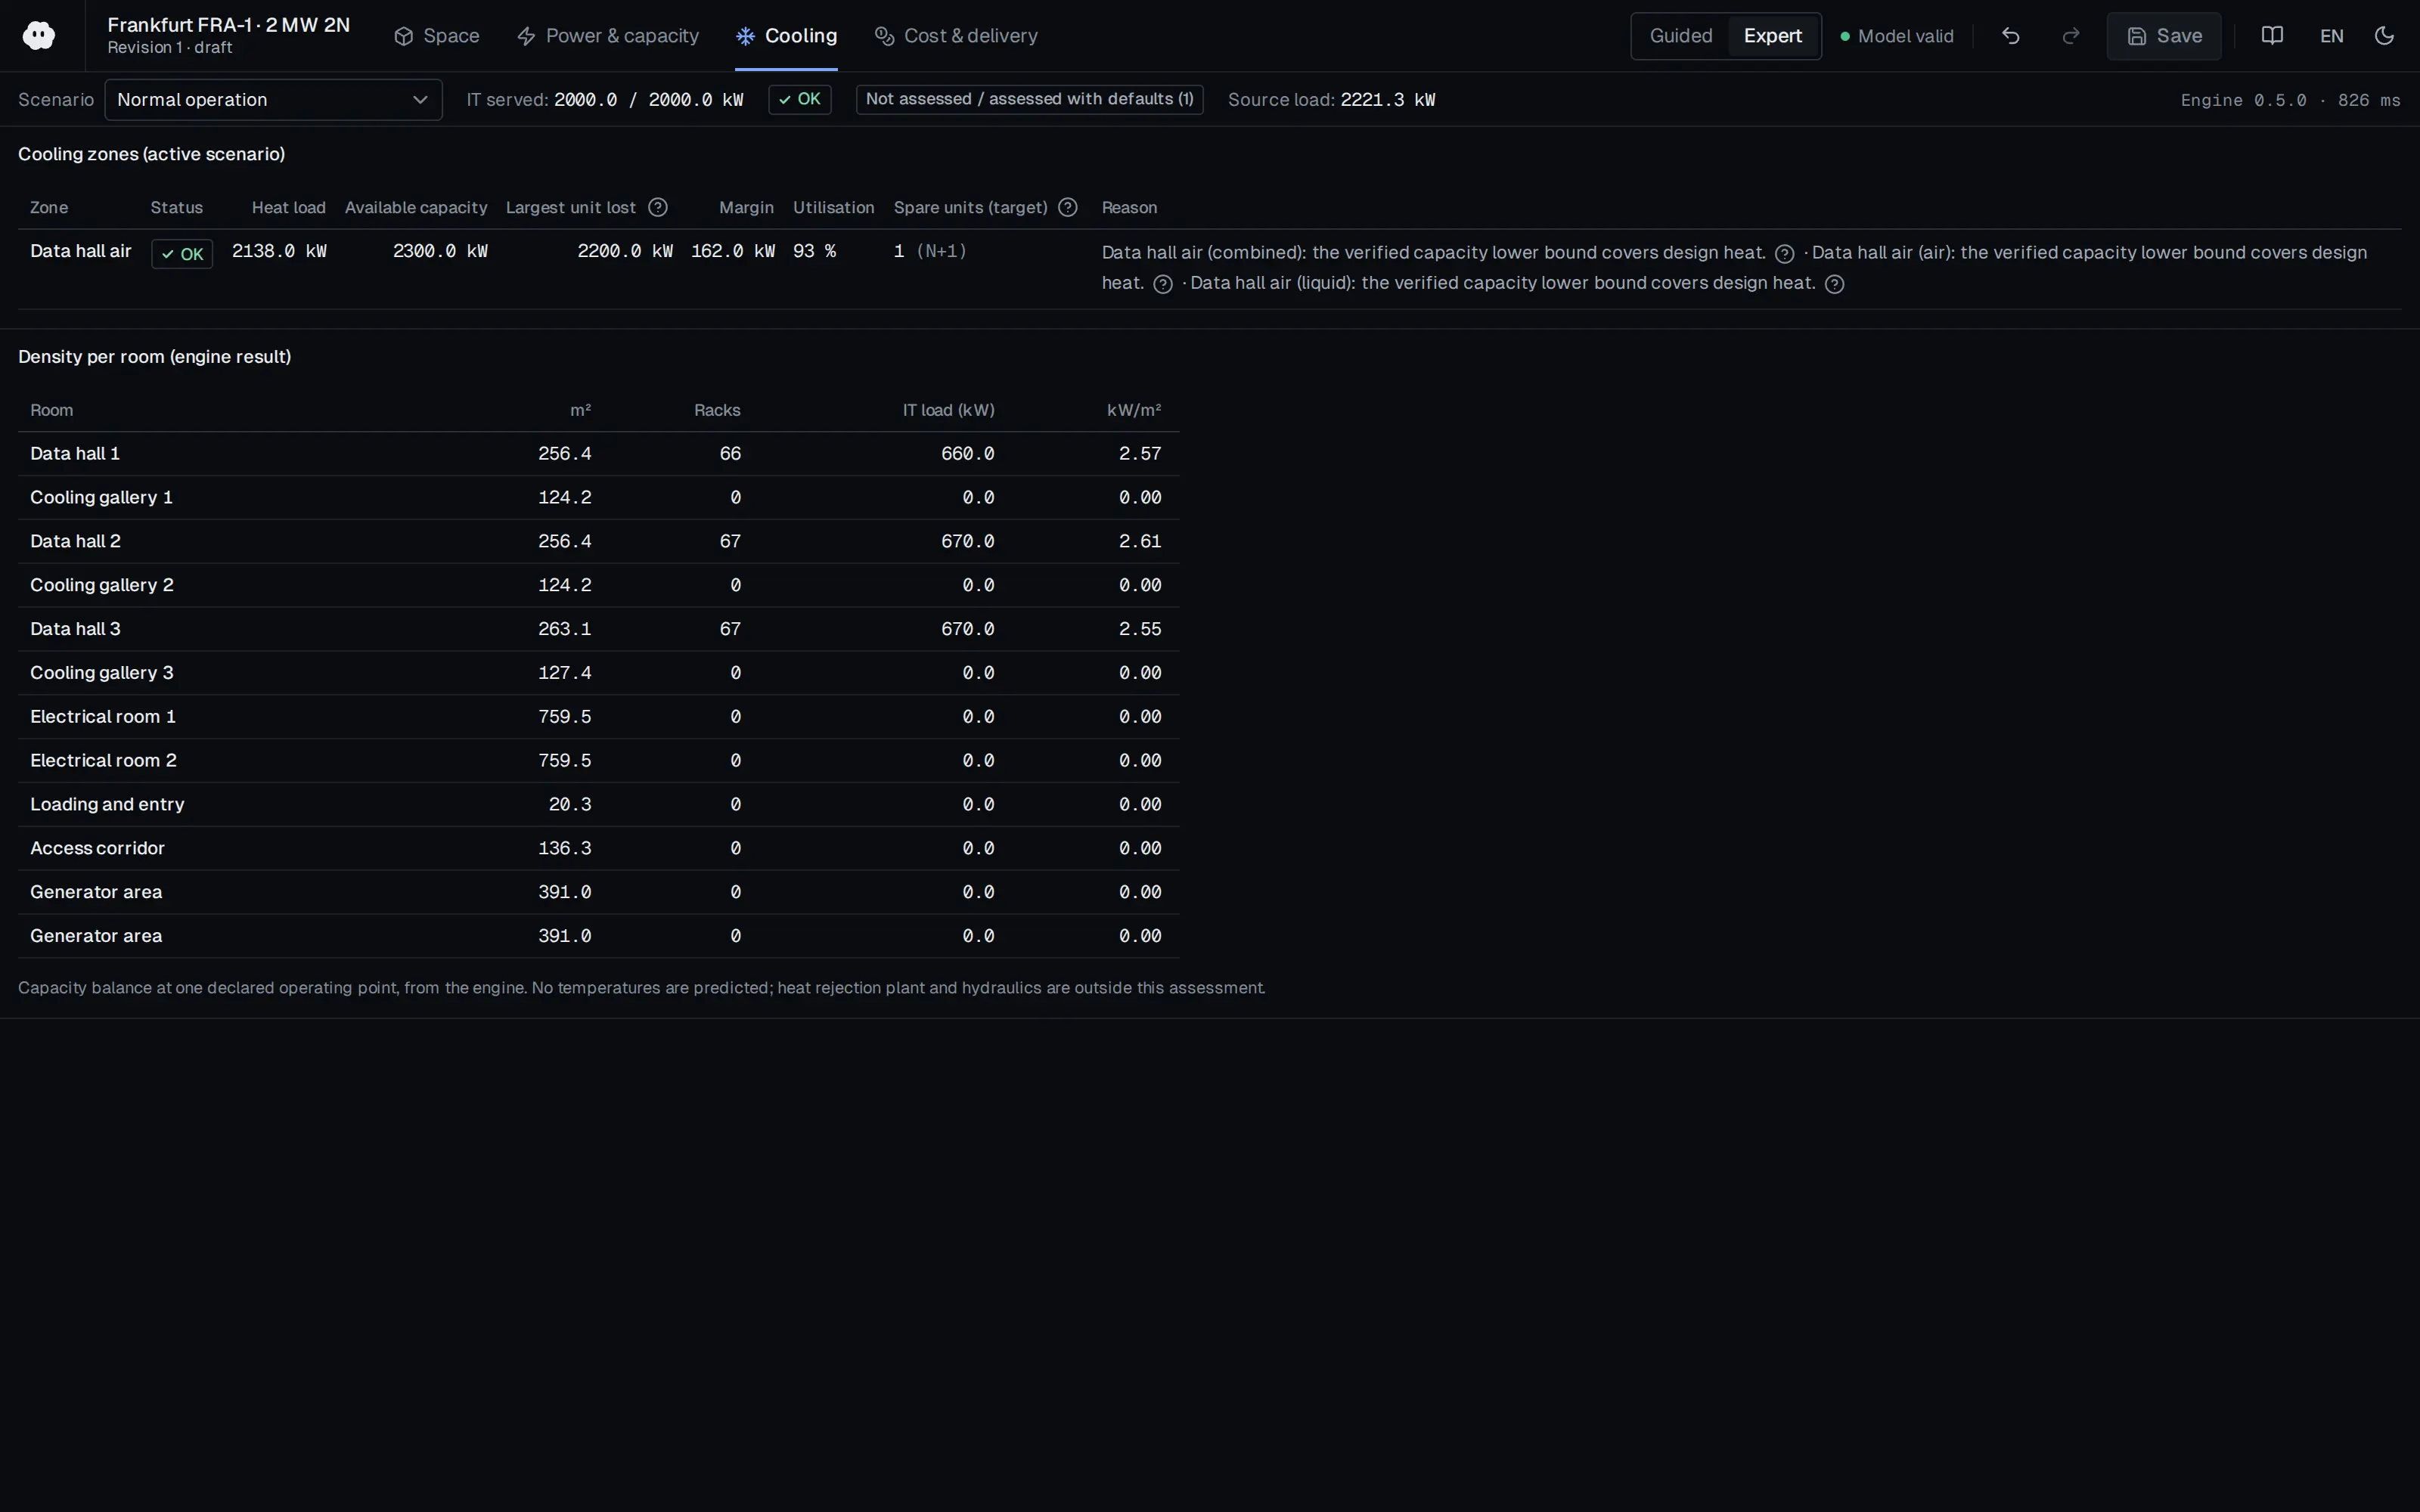
Who should read it
Cooling engineers evaluating underfloor air distribution and aisle containment options in small server rooms.
Document contents
- 1. Introduction
- 2. Research Methodology (2.1 Experimental Testing: establishment of geometric model, description of experimental testing; 2.2 Numerical Method and Boundary Conditions; 2.3 Thermal Environment Evaluation Indicators)
- 3. Results and Discussion (3.1 Validation of Experimental and Simulation Results, 3.2 Analysis of Data Center Thermal Environment Simulation Results)
- 4. Airflow Distribution Optimization Strategy (4.1 Raised Floor Height Adjustment: airflow volume, pressure field, temperature field, evaluation indicators; 4.2 Closed Cold/Hot Aisles: streamline analysis, evaluation indicators, impact of increased air supply temperature)
- 5. Conclusions
Related standards
- GB 50174 Code for design of data centers
- ASHRAE TC 9.9 Thermal Guidelines for Data Processing Environments
Read the document
small-dc-underfloor-airflow-2025.pdf
CC BY 4.0 — share with attribution
The document is provided unaltered because its licence permits redistribution.
Publication details
- Authors
- Fengjiao Yu; Hongbing Chen; Wenqian Wang; Jingjing An
- Publisher
- Buildings (MDPI AG)
- Year
- 2025
- Volume
- 15
- Issue
- 3
- Pages
- 428
- Document language
- English
- Source type
- Scientific
- Access
- Open licence — downloadable
- Licence
- CC BY 4.0 — share with attribution
- Licence evidence
- www.mdpi.com
Original licence note
PDF p.1: Licensee MDPI; open access article distributed under the terms and conditions of the Creative Commons Attribution (CC BY) license.
Citation
Fengjiao Yu; Hongbing Chen; Wenqian Wang; Jingjing An (2025). Optimization Strategies for Underfloor Air Distribution in a Small-Scale Data Center. Buildings (MDPI AG). 15(3), 428. https://doi.org/10.3390/buildings15030428
Events on this subject
Browse the events calendarAll content and rights belong to the respective authors and publishers. SoSo CAD provides only the citation, its own summary and a link to the source, and is not responsible for the sources' content.
Related sources
All sources on this topic
Buildings (MDPI AG) 2026
Thermal Environment Assessment for Energy-Efficient Cooling in Air-Cooled Data Centers: Measurement, CFD, and Predictive Models
In a design tool, set CFD accuracy expectations from this review's ranges (0.1-4 °C absolute, relative mostly below 20%) and do not limit validation scope to temperature; ask for velocity and pressure too.
- Of the 58 CFD studies, Fluent was used in 24 (41.4%) and 6SigmaDC in 12; standard k-epsilon in 41 (about 70.7%).
Applied System Innovation (MDPI AG) 2026
Proactive Cooling Control Algorithm for Data Centers Based on LSTM-Driven Predictive Thermal Analysis
For predictive cooling control, plan at least one inlet and one outlet temperature sensor per rack; below that, prediction error rose by about 22%.
- The LSTM uses a 60 min input window and a 30 min prediction horizon, with a reported RMSE of 0.25 and R² of 0.985.
Sustainability (MDPI AG) 2026
Retrofit Optimization of Raised-Floor Plenum Thermal Performance for Energy-Efficient and Sustainable Operation of Non-Standard Campus Data Centers
For plenum imbalance, consider a 50%-perforated transverse baffle about 0.3 m from the unit outlet; 50% open gave a smaller resistance increase than 30% (8.5% against 18.7%).
- For S4, SHI fell from 0.42 to 0.35, maximum rack inlet temperature fell from 27.2 °C to 26.7 °C, and all racks met the 27 °C ASHRAE recommended limit.
Applied Sciences (MDPI AG) 2025
Optimization of Airflow Organization in Bidirectional Air Supply Data Centers in China
In retrofitting an existing raised-floor hall, first close unused rack spaces with blanking panels (alone they cut SHI by 42.61%); containment alone gave little benefit.
- Baseline RTI 0.786, SHI 0.230, RCI-HI 0.992. Blanking alone: SHI 0.132, RCI-HI 1. Blanking plus full CAC (Case 7): RTI 1, SHI 0.027.
Energies (MDPI AG) 2025
A Review of Non-Uniform Load Distribution and Solutions in Data Centers: Micro-Scale Liquid Cooling and Large-Scale Air Cooling
For high-heat-flux chips, weigh the pump-power increase of complex microchannel cold-plate geometry against the thermal-resistance gain (for example 11.8%).
- Chip heat flux is described as reaching ultra-high levels of 10^6-10^7 W/m².
Buildings (MDPI AG) 2024
Improving Thermal Performance in Data Centers Based on Numerical Simulations
If cabinets in the rows nearest the cooling units run hot (high-velocity plenum flow starving the nearest tiles), consider adjustable underfloor deflectors and grille opening adjustment before fan-assisted tiles (18.1% and 4.9% airflow shift).
- The largest drop in average cabinet outlet temperature was 2.81 °C.