
Data centre construction cost index 2025-2026 (press release: AI data centre rush raises alarm over construction supply chain)
Turner & Townsend
Press release summary of Turner & Townsend's annual benchmark of data centre construction cost per watt across 52 markets.
On this page
Overview
This document is the press release summary of Turner & Townsend's annual benchmark of data centre construction cost per watt across 52 markets. According to the release, cost inflation for traditional air-cooled facilities has slowed: the average across 52 markets in 2025 is 5.5%. AI-ready halls in the US, however, carry a 7-10% construction premium over traditional facilities of similar IT capacity.
The highest-cost markets (US$/W) are Tokyo 15.2, Singapore 14.5, Zurich 14.2, Osaka 14.1 and Silicon Valley 13.3, with London at 12.0 and Frankfurt at 11.6. These figures are indicative benchmarks, not project estimates.
A survey component highlights supply chain unreadiness for advanced cooling and power availability as the main schedule risks: 83% of respondents say local supply chains are not ready for advanced cooling, and 48% cite power availability as the biggest obstacle to on-time delivery. As a press release the document contains no method detail; the values are dated and regional, so they must be adapted to local conditions.
Key points
- Average construction cost inflation for traditional data centres: 5.5% in 2025 across 52 markets.
- AI data centres in the US carry a 7-10% construction premium over traditional facilities of similar IT capacity.
- Highest cost markets (US$/W): Tokyo 15.2, Singapore 14.5, Zurich 14.2, Osaka 14.1, Silicon Valley 13.3; London 12.0, Frankfurt 11.6.
- 83% of respondents say local supply chains are not ready for advanced cooling.
- 48% cite power availability as the biggest obstacle to on-time delivery.
- Figures are indicative US$/W benchmarks, not project estimates.
- Freely available source.
Using it in design
- Seed the cost module with regional US$/W benchmarks by market and year, with an AI/liquid-cooled premium factor (7-10% default for the US).
- Label the figures as indicative and dated so users replace them with project estimates.
- Track the cooling supply chain and power availability as separate items in schedule risk.
Monthly newsletter · free
Keep your reading list current
Once a month: new library sources, changes to Turkish regulations and upcoming data centre events.
SoSo CAD
Check cooling capacity alongside your design
Review zone heat loads, available capacity and the capacity balance after the largest unit is lost in SoSo CAD.
Request a demo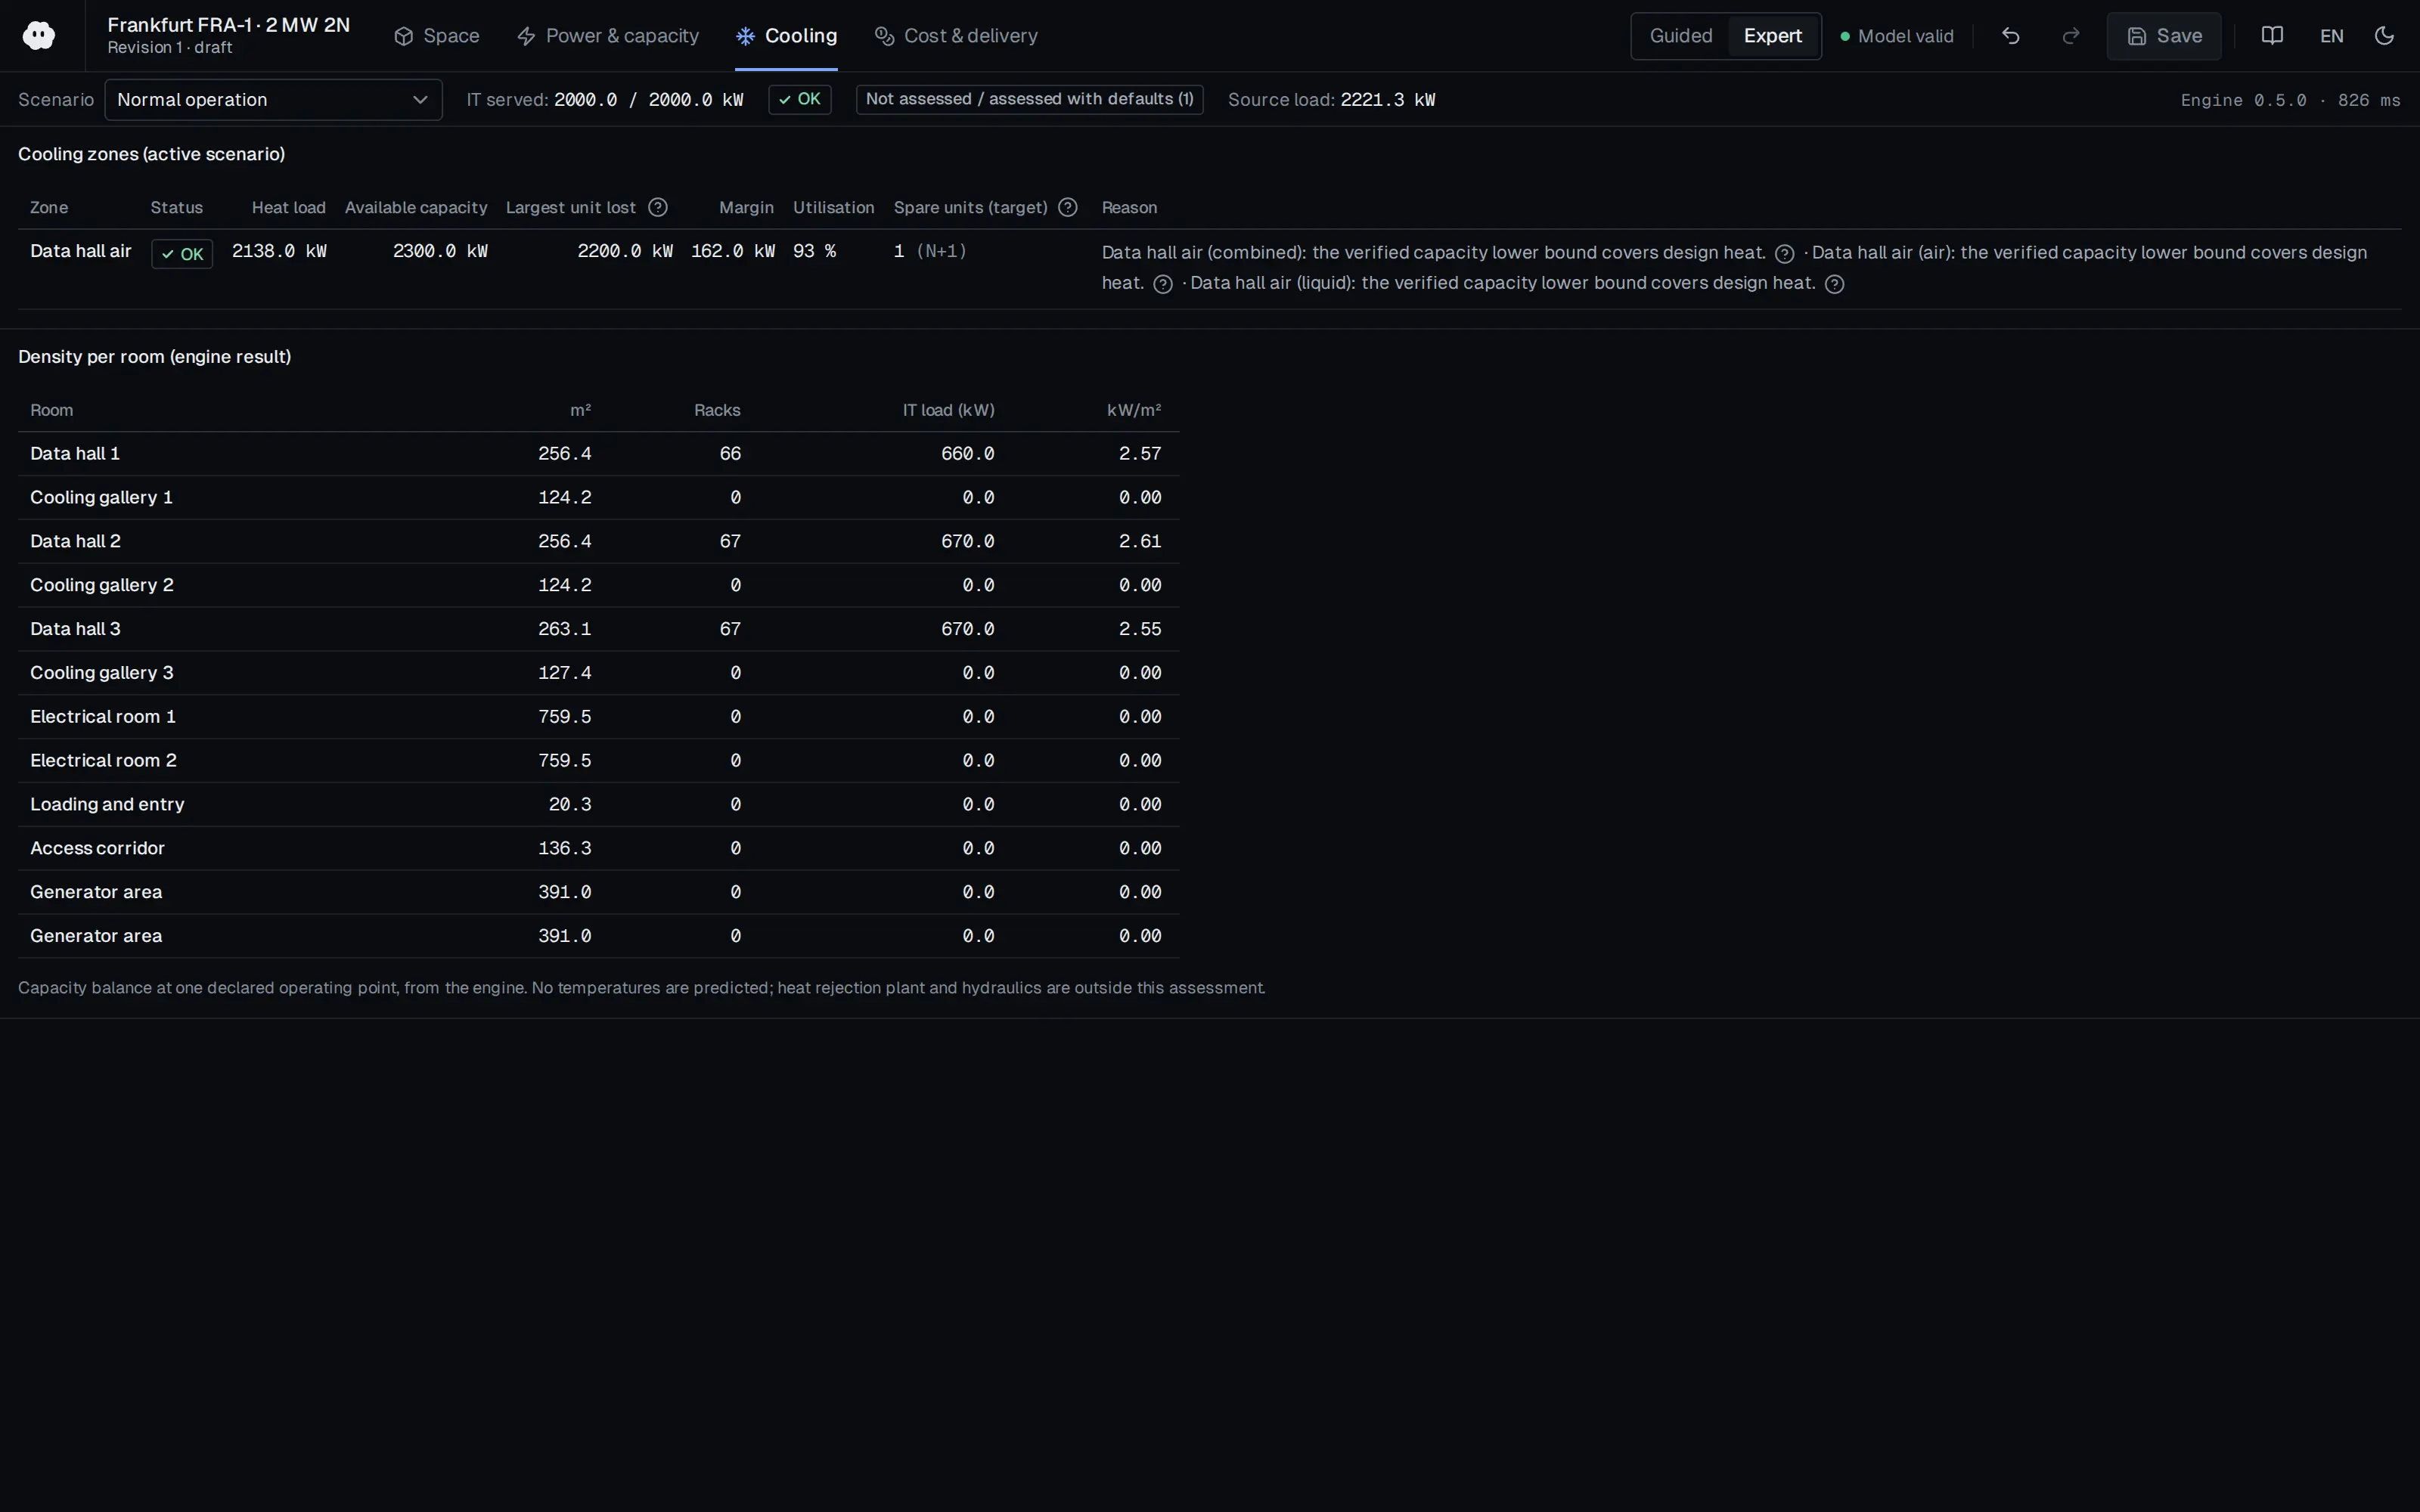
Who should read it
Developers, cost consultants and designers preparing data centre investment budgets and schedules.
Publication details
- Authors
- Turner & Townsend
- Publisher
- Turner & Townsend
- Year
- 2025
- Document language
- English
- Source type
- Expert / community
- Access
- Free to read
- Licence
- Copyright retained; citation only — the publisher’s terms apply to the original document
Citation
Turner & Townsend (2025). Data centre construction cost index 2025-2026 (press release: AI data centre rush raises alarm over construction supply chain). Turner & Townsend. https://www.turnerandtownsend.com/news/ai-data-centre-rush-raises-alarm-over-construction-supply-chain
Events on this subject
Browse the events calendarAll content and rights belong to the respective authors and publishers. SoSo CAD provides only the citation, its own summary and a link to the source, and is not responsible for the sources' content.
Related sources
All sources on this topicTurner & Townsend 2026
Data Centre Construction Cost Index 2026-27
In the cost module, provide a country and city $/W construction rate table and state the edition year.
- 62 markets (12 new); more than 500 projects; 401 survey respondents.

Open Compute Project Foundation 2026
Open Data Center: Next-Generation ML Infrastructure Design Principles, Revision 0.7.0 (Design Specification, effective Aug 27, 2026)
Base floor and transport-route load checks on the 8,000 lb rack and the 15,000 lb rack-plus-sidecar combination, and include the weight of the moving equipment.
- Available quick connects currently top out at 2 in.
Open Compute Project Foundation 2022
Guidelines for Connection of Liquid Cooled Information Technology Equipment (ITE) to Data Center Facility Systems, Revision 1, Version 1.0 (April 2022)
Place standard tap-off points with isolation valves, vent/drain/flush connections and strainers at every rack or CDU connection in liquid cooling layouts, sized from Q = flow x delta T x cp so future kW per position is explicit.
- Keeping FWS liquid above dew point avoids condensation; the ASHRAE recommended dew point limit for air-cooled classes A1-A4 is 15 C.
Bryden Wood 2026
Densification and the geometry of change: designing data centres in an age of uncertainty
Warn when high-density liquid-cooled racks are placed on upper floors without a matching structural floor-load rating.
- Delivery takes three to five years, so a 30 kW/rack design may need to carry twice that at go-live.
Data Center Knowledge 2026
Liquid Cooling Retrofits: Hard, but Sometimes Worth It (Christopher Tozzi)
Add a retrofit check comparing liquid-cooled rack weight (default up to about 3,000 lb / 1,360 kg) with the raised-floor rating.
- Fully loaded AI racks with liquid cooling can exceed 3,000 lb, which raised floors may not support without reinforcement.
Schneider Electric 2026
Prefabricated White Space Module Time Study: Lessons from a High-Density Liquid-Cooled Deployment
Offer a 'prefabricated IT pod' option in the white-space designer, with catalog defaults 1.2 MW, 42 racks, 93 m2.
- Learning curve: earlier pods 18 h on site versus 15 h later, a 17% improvement.