
Determining Total Cost of Ownership for Data Center and Network Room Infrastructure
Schneider Electric · Neil Rasmussen
Schneider Electric WP 6 proposes normalizing physical-infrastructure TCO per rack, and uses a 100 kW, 10-year model to show that unabsorbed cost from oversizing is the largest cost driver.
On this page
Overview
The paper expresses physical-infrastructure TCO per rack so that different facilities and designs can be compared against the IT work they support. The model rests on 100 kW of capacity and a 10-year life, and TCO is split into capex and opex categories. In the example breakdown electricity, service, power equipment, cooling equipment, installation, racks, space and engineering are the main buckets, with electricity the largest single opex item.
A high-availability data center has a lifetime physical-infrastructure TCO of about $120k per rack, roughly half capex and half opex. The key finding concerns utilization: a typical data center runs at about 30% of design capacity, with a range from about 10% to over 90%. The cost of paying for unused capacity is the single largest driver. The paper calls this share unabsorbed cost.
Modular, scalable infrastructure is therefore recommended, with capacity added as load grows. Practical rightsizing is estimated to save about 30% of TCO on average. The paper dates from 2011, so its cost categories and proportions reflect that period's prices, but per-rack normalization and the unabsorbed-cost logic remain a usable comparison method. In a modular build only the capacity needed for the expected load is bought on day one and the rest is added as load grows, which explains why the typical 30% utilization is so costly.
Key points
- Lifetime physical-infrastructure TCO of a high-availability data center is about $120k per rack, roughly half capex and half opex.
- Typical utilization is about 30% of design capacity (range about 10% to over 90%).
- Model basis: 100 kW capacity, 10-year life.
- Rightsizing with modular scalable infrastructure saves about 30% of TCO on average.
- Main cost buckets: electricity, service, power equipment, cooling equipment, installation, racks, space, engineering; electricity is the largest opex item.
Using it in design
- Have the TCO engine report cost per rack and per kW over a user-selectable life (default 10 years) and split capex from opex.
- Add a phased build-out mode where capacity modules are deployed as load ramps.
- Show unabsorbed cost for a day-one full build versus a modular build.
- Start the default utilization ramp near 30%.
Monthly newsletter · free
Keep your reading list current
Once a month: new library sources, changes to Turkish regulations and upcoming data centre events.
SoSo CAD
Assess redundancy through scenarios
Compare normal operation and equipment failures in SoSo CAD, with supplied loads and capacity shortfalls in one view.
Request a demo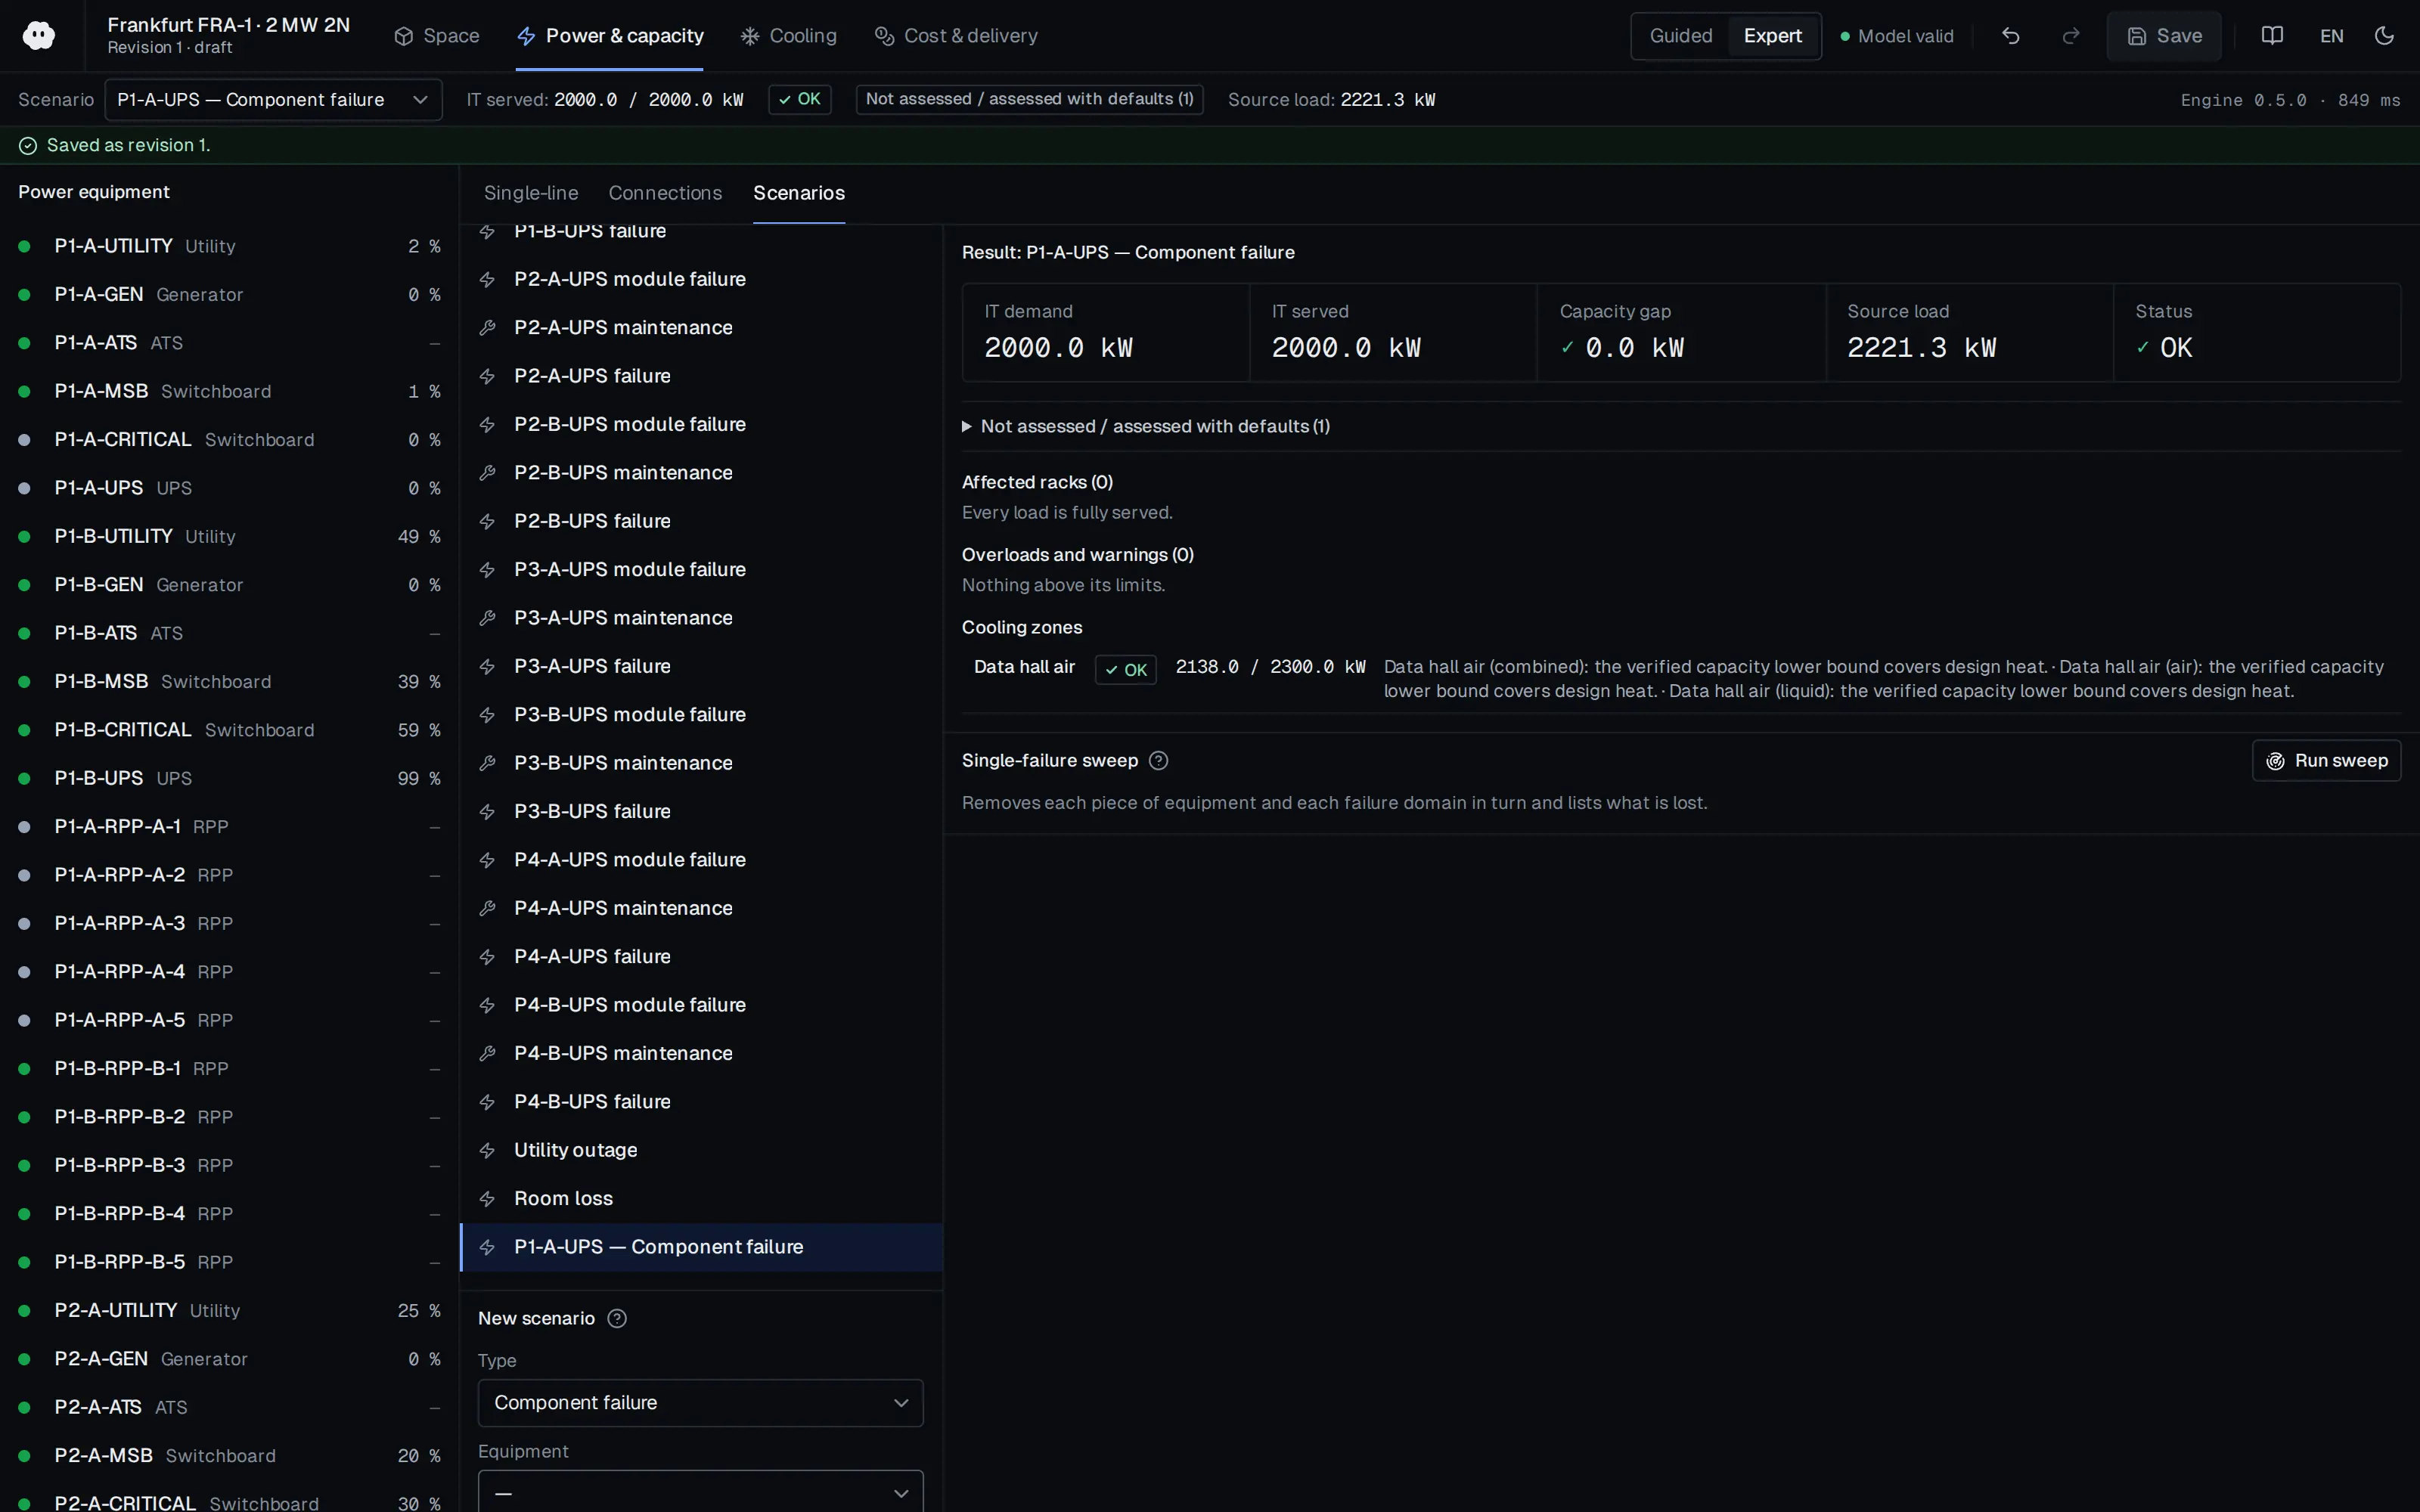
Who should read it
Designers preparing data center investment budgets and managers deciding whether to grow capacity in stages.
Related standards
- EN 50600-1
Publication details
- Authors
- Neil Rasmussen
- Publisher
- Schneider Electric
- Year
- 2011
- Document number
- WP 6
- Document language
- English
- Source type
- Manufacturer
- Access
- Free to read
- Licence
- Copyright retained; citation only — the publisher’s terms apply to the original document
Citation
Neil Rasmussen (2011). Determining Total Cost of Ownership for Data Center and Network Room Infrastructure. Schneider Electric. WP 6. https://download.schneider-electric.com/files?p_Doc_Ref=SPD_CMRP-5T9PQG_EN
Events on this subject
- Hannover Messe
- SC26 – International Conference for High Performance Computing, Networking, Storage and Analysis
- iMasons Climate Accord Summit
All content and rights belong to the respective authors and publishers. SoSo CAD provides only the citation, its own summary and a link to the source, and is not responsible for the sources' content.
Related sources
All sources on this topic
Proceedings of the 2023 ACM Symposium on Cloud Computing (ACM) 2023
Sustainable Supercomputing for AI: GPU Power Capping at HPC Scale
Consider a GPU power cap (for example 60% of peak) as a control in capacity and cooling planning: about 10 W per job and a 4.78 °C lower mean temperature were reported.
- A 60% power cap was deployed on GPUs at an academic supercomputing center.
Uptime Institute 2025
Uptime Institute Global Data Center Survey 2025 (15th annual) — press release and public highlights
Use PUE 1.54 as the 'industry average' line on the efficiency dashboard, year-stamped and user-overridable
- Survey run April-May 2025 with 800+ respondents
arXiv preprint (Microsoft Azure) 2023
POLCA: Power Oversubscription in LLM Cloud Providers
In the power planner, apply different diversity and oversubscription factors by workload: inference rows can be provisioned below sum-of-nameplate (for example peak about 80% of provisioned), while training rows should assume near-coincident peaks with only about 10% headroom.
- POLCA allows 30% more servers in the same inference GPU cluster while maintaining SLOs.
Schneider Electric 2026
How 6 AI Attributes Change Data Center Design
Add an AI cluster design profile with rack defaults of 750x1,200 mm, 48U, static 2,270 kg and dynamic 1,600 kg.
- GPU TDP trend: V100 300 W, A100 400 W, H100 700 W, B200 1,000 W, B300 1,400 W.
Schneider Electric 2024
Power and Cooling Capacity Management for Data Centers
For every rack, row and upstream device store design maximum supply, design maximum demand (nameplate or as-configured) and measured actual where available; enforce supply >= demand at each hierarchy level including under N-1.
- Safety margins are typically 10-20%, up to 30% or more with weak change control.
Schneider Electric 2024
Calculating ROI of Monitoring and Maintenance Service Contracts for New Data Centers
Add an efficiency-degradation factor to the opex model for run-to-fail operation (+19%/+29%/+39%/+51% cooling energy in years 2 to 5) against the maintained case.
- Average truck roll costs about $1,000 per dispatch.