
Survey findings link higher redundancy to lower outage risk (Owen Rogers, Douglas Donnellan)
Uptime Institute Journal · Owen Rogers, Douglas Donnellan
An article combining Uptime's 2025 and 2026 annual survey responses to show the relationship between power and cooling redundancy and reported outages, best used as an indicative benchmark.
On this page
Overview
This article, written by Owen Rogers and Douglas Donnellan in the Uptime Institute Journal, is an analysis that combines more than 1,200 responses from the 2025 and 2026 annual Uptime surveys. Its aim is to correlate power and cooling redundancy configurations (N, N+1, N+2, 2N) with outages reported over three years.
The core finding is that outage incidence and serious (category 3-5) outages fall consistently as redundancy increases. The share reporting at least one impactful outage in three years is 70% with N and 39% with 2N for cooling, and 68% with N and 42% with 2N for power. Category 3-5 outages, regarded as financially meaningful, occur at about 8-11% of 2N respondents against about 19-22% of N respondents.
In quantifying the gains, versus N the likelihood of a serious outage was about 36% lower for N+1 cooling, 53% for N+2 and 63% for 2N; for power the figures are 23%, 37% and 44%. Using N+1 as the baseline, 2N cooling is 42% and N+2 cooling 26% less likely to have an outage. In addition, power and cooling together cause more than two-thirds of impactful outages in the 2026 survey.
The authors stress that this is correlation and should be used as an indicative benchmark and not a prediction for an individual site. Survey data rests on reporting; besides redundancy, factors such as facility age, operating maturity and maintenance quality may also influence outage frequency. The ratios should therefore be read as relative risk multipliers when comparing design options and not as a substitute for a reliability calculation.
Key points
- Share reporting at least one impactful outage in 3 years: cooling 70% with N vs 39% with 2N; power 68% with N vs 42% with 2N.
- Category 3-5 outages: about 8-11% of 2N respondents vs about 19-22% of N respondents.
- Versus N, serious outage likelihood was about 36% lower for N+1 cooling, 53% for N+2 and 63% for 2N.
- Power, same comparison: 23%, 37% and 44%.
- With N+1 as baseline, 2N cooling is 42% and N+2 cooling 26% less likely to have an outage.
- Power and cooling together cause more than two-thirds of impactful outages in the 2026 survey.
- Based on over 1,200 responses from the 2025 and 2026 surveys; findings are correlation, not prediction.
Using it in design
- Use these ratios as indicative risk multipliers in an option-comparison view, for example showing relative outage likelihood when switching cooling from N+1 to 2N.
- Label them clearly as survey correlation, not a reliability calculation.
- Assess power and cooling redundancy together, noting in the rationale that most outages originate in these two systems.
Monthly newsletter · free
Keep your reading list current
Once a month: new library sources, changes to Turkish regulations and upcoming data centre events.
SoSo CAD
Assess redundancy through scenarios
Compare normal operation and equipment failures in SoSo CAD, with supplied loads and capacity shortfalls in one view.
Request a demo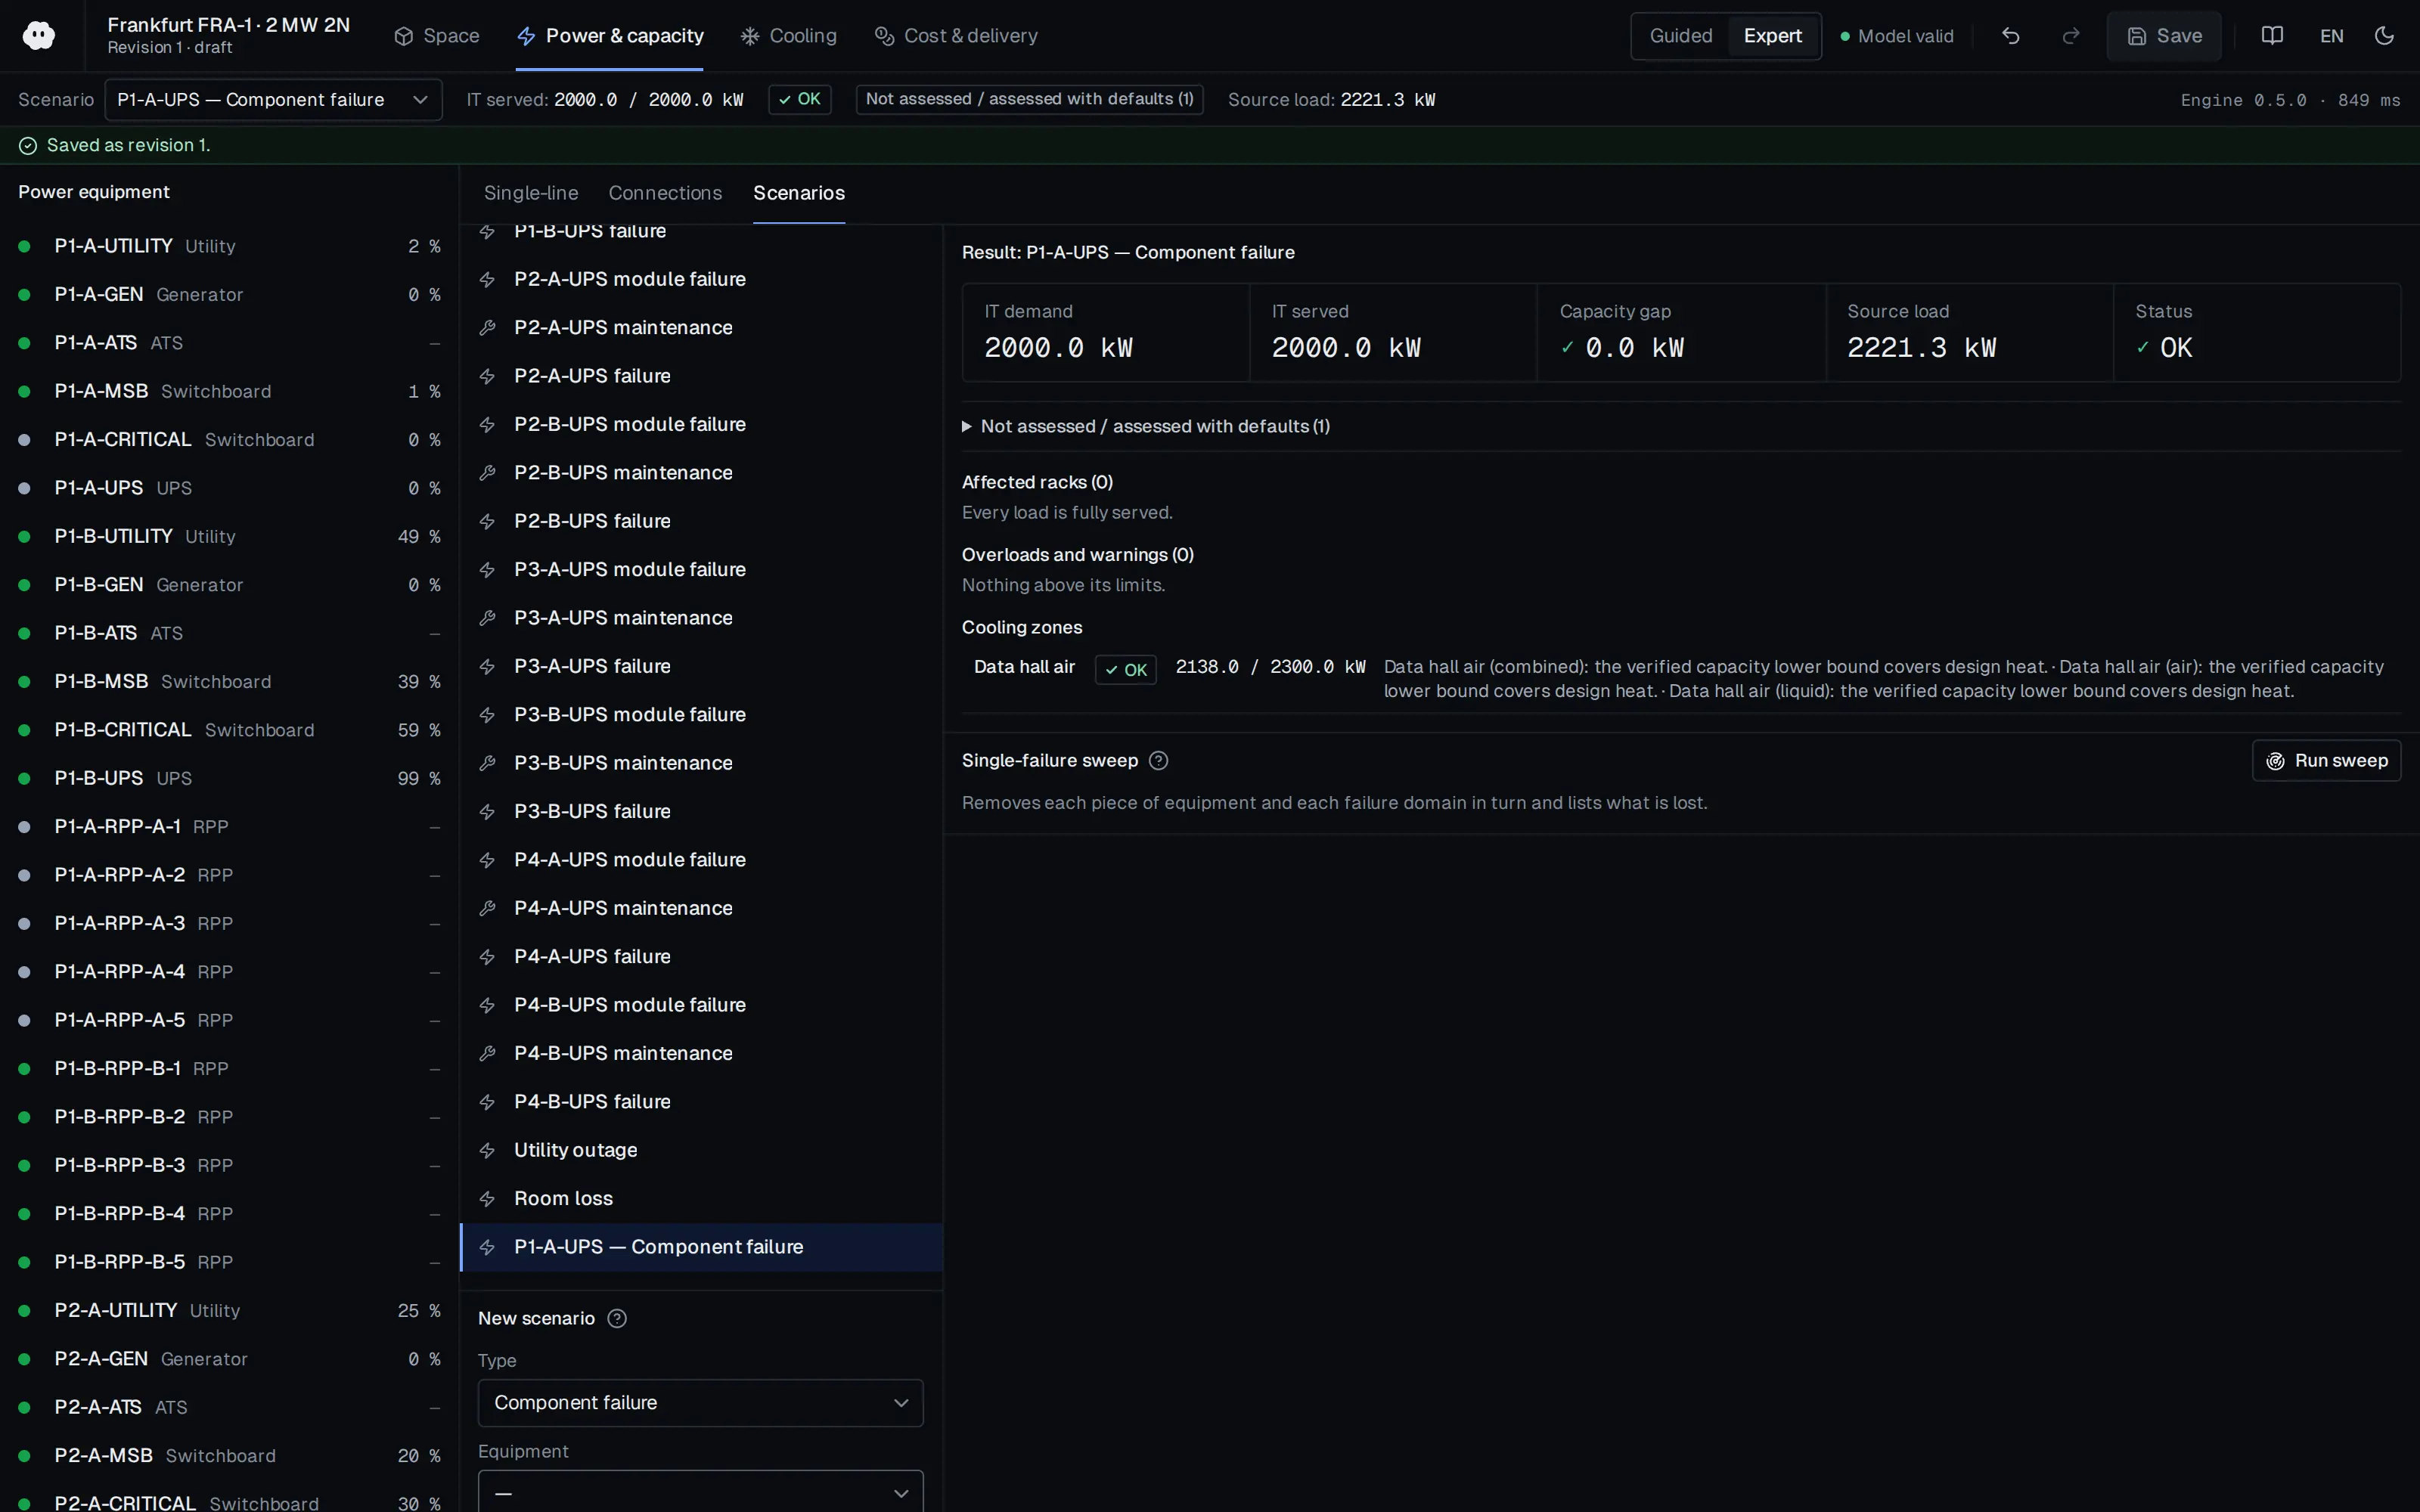
Who should read it
Designers, operators and investment decision makers deciding on redundancy level.
Publication details
- Authors
- Owen Rogers; Douglas Donnellan
- Publisher
- Uptime Institute Journal
- Year
- 2026
- Document language
- English
- Source type
- Industry body
- Access
- Free to read
- Licence
- Copyright retained; citation only — the publisher’s terms apply to the original document
Citation
Owen Rogers; Douglas Donnellan (2026). Survey findings link higher redundancy to lower outage risk (Owen Rogers, Douglas Donnellan). Uptime Institute Journal. https://journal.uptimeinstitute.com/survey-findings-link-higher-redundancy-to-lower-outage-risk/
Events on this subject
Browse the events calendarAll content and rights belong to the respective authors and publishers. SoSo CAD provides only the citation, its own summary and a link to the source, and is not responsible for the sources' content.
Related sources
All sources on this topicUptime Institute 2026
Uptime Institute Tier Classification System
Model 'reliability.target' as an enum {TierI..TierIV} driving topology defaults: Tier I single path N; Tier II N+1 capacity components, single path; Tier III N+1 components AND two distribution paths (one may be passive), concurrently maintainable; Tier IV 2N or 2(N+1), two active physically compartmentalized paths and continuous cooling with UPS-backed pumps/fans.
- Over 4,300 Tier Certification awards in 120+ countries (2026).
Uptime Institute 2018
Tier Standard: Topology
For Tier III/IV targets, accept only generator ratings flagged 'continuous' or unlimited-hours in the sizing module
- Minimum 12 hours of on-site fuel at N design load is the baseline; many sites choose 24-72 h
Headquarters, Department of the Army (U.S. Army Corps of Engineers) 2007
TM 5-698-1 Reliability/Availability of Electrical & Mechanical Systems for Command, Control, Communications, Computer, Intelligence, Surveillance and Reconnaissance (C4ISR) Facilities (19 January 2007)
When writing an availability target into a data centre specification, state the measurement interval as well; the same downtime gives 95.83 or 99.86 percent depending on the interval.
- With exponentially distributed failures, reliability at an operating time equal to the MTBF is only about 37 percent (e^-1 = 0.368).
Headquarters, Department of the Army (U.S. Army Corps of Engineers PREP) 2006
TM 5-698-5 Survey of Reliability and Availability Information for Power Distribution, Power Generation, and Heating, Ventilating and Air Conditioning (HVAC) Components for Commercial, Industrial, and Utility Installations (22 July 2006)
When modelling the power and cooling chain use these values as starting failure rates and MTBF/MTTR inputs and convert them into availability with the method of TM 5-698-1.
- Diesel engine generators overall: 0.528 failures/yr, MTBF about 16,590 h, MTTR 24.22 h, operational availability 0.99399.
ISO/IEC 2026
Information technology - Data centre facilities and infrastructures - Part 31: Key performance indicators for resilience
In the reliability module, add a resilience-level calculator that compares alternative power/cooling topologies on maintainability, recoverability and vulnerability.
- Related: ISO/IEC 22237-1, EN 50600-4-31, IEEE 3006.7.
TÜV NORD 2026
EN 50600 — data centre facilities and infrastructures (overview and certification)
In an 'EN 50600' standards profile, offer separate availability-class selectors for power, cooling and cabling (instead of a single Tier), plus a protection-class selector per room or zone
- Protection classes 1-4 for unauthorised access and other hazards; physical-security zoning required