Topic guide

Racks

Explore sources on rack layouts, power density and IT equipment interfaces. Review technical notes to understand how mechanical, electrical and cooling requirements meet at the rack level.

Sources
191
Downloadable PDFs
52
Years
2008–2026

All sources

25–48 / 191

White paperFree to read

Schneider Electric 2015

Data Center Projects: Establishing a Floor Plan

Run the layout engine on a 600 mm / 2 ft grid with row-pair pitch presets A-D (14/16/16/18 ft), auto-selected from raised-floor, rear-door accessory, containment and density inputs.

  • Rack-location estimate: room area / 28 sq ft (2.6 m2) per rack.
White paperFree to read

Eaton 2013

Data Center Trend: Distributed Power in the White Space

Allow UPS placement in the white space with an airflow-pattern attribute (front-to-back, front-to-top) and count its heat release in the hall cooling load.

  • A 480 V UPS input/output needs no neutral (three wires) and thinner cables than 208 V; a PDU next to the UPS steps down to 208/120 V.
Research paperPDF

Springer Science and Business Media LLC (preprint) 2026

Design and Development of a Next-Generation Medium-Voltage Architecture for AI Data Centre Infrastructure

Make the 0.1-10 Hz oscillation, 1.40 peak-to-mean ratio and coincidence factor explicit inputs in the AI campus load model, and check storage and buffering against grid ramp limits.

  • Conductor mass falls by 97.1%, electrical footprint by 58.1%, annual PUE from 1.42 to 1.11 and 15-year TCO by 32.4%.
Technical guideFree to read

Open Compute Project Foundation 2025

Door Heat Exchanger Sub-Project Updates (OCP EMEA Summit 2025)

Record approach temperature difference, P-Q curve, fan/pump redundancy and coil material in rear-door and sidecar catalogue items.

  • Sidecars should align with ORv3 dimensions using Single Rack Space units; pumps and fans redundant and hot-swappable, heat exchanger treated as a single point of failure.
Research paperPDF

Environmental Research: Energy (IOP Publishing) 2025

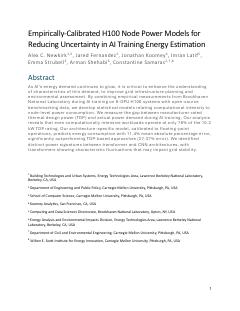
Empirically-Calibrated H100 Node Power Models for Reducing Uncertainty in AI Training Energy Estimation

Calculate AI training cluster energy and power demand from measured node power (here 7.3-7.79 kW in training, 76% of TDP) rather than TDP; a TDP-based estimate inflated a 20,000-GPU cluster by 19 GWh.

  • Even computationally intensive training workloads operated at only 76% of the 10.2 kW node TDP rating.
Technical guidePDF

U.S. Environmental Protection Agency (ENERGY STAR) 2022

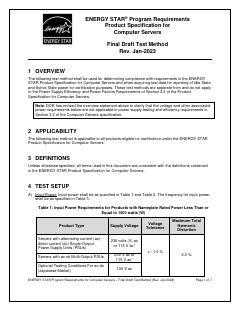
ENERGY STAR Program Requirements for Data Center Storage, Version 2.1 (Partner Commitments and Eligibility Criteria)

Catalogue entries for storage should carry ENERGY STAR status, PSU efficiency curve points (20/50/100%) and power factor, so the rack power model can derive input power and heat from IT load rather than nameplate.

  • PSU power factor minimums: 0.80/0.90/0.95 at 20/50/100% load.
White paperPDF

Open Compute Project Foundation 2023

Evaluating the Limits of Door Heat Exchanger Solutions Optimized for Open Rack V3

Build a rear-door HX sizing helper that takes rack kW, airflow (cfm), facility water temperature and liquid-capture fraction and returns approach, leaving air temperature and fan power, with 27 C facility water and 30 C air as default reference points.

  • Assumptions: 30 C ambient (cold-aisle upper limit), sea level, 12-15 C air delta T, W27 facility water.
Research paperPDF

Frontiers in Heat and Mass Transfer (Tech Science Press) 2026

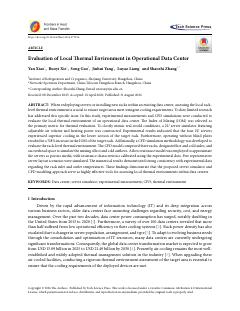
Evaluation of Local Thermal Environment in Operational Data Center

Before adding servers to an existing hall, measure the local thermal environment of the target rack in place with server simulators and score it with IOM; RCI, SHI or RTI average away within-rack non-uniformity.

  • Removing blanking plates raised IOM by 31%, 358%, 718%, 84% and 85% across the five layouts, with inlet temperatures up by as much as 29%; in two layouts IOM exceeded 2.0.
Research paperPDF

arXiv preprint (Stanford University / Microsoft Azure Research) 2026

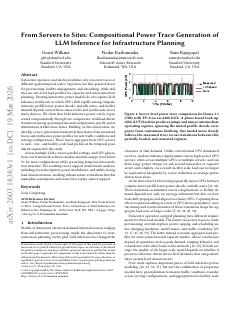
From Servers to Sites: Compositional Power Trace Generation of LLM Inference for Infrastructure Planning

For an AI inference facility, set interconnection capacity from traces generated from the workload, not nameplate TDP or mean power; TDP sizing gave 1.19 MW against 0.75 MW trace-based (about 60% too much).

  • Generated facility traces show a peak-to-average ratio of 1.19, a load factor of 0.84 and a maximum 15-minute ramp of 0.11 MW.

All content and rights belong to the respective authors and publishers. SoSo CAD provides only the citation, its own summary and a link to the source, and is not responsible for the sources' content.

Monthly newsletter · free

Keep your reading list current

Once a month: new library sources, changes to Turkish regulations and upcoming data centre events.