Topic guide

Energy

Discover publications on data centre energy consumption, power demand and efficiency. Investigate measurement methods, operating conditions and improvement approaches through summaries and original references.

Sources
416
Downloadable PDFs
122
Years
2007–2026

All sources

25–48 / 416

White paperFree to read

Schneider Electric 2011

AC vs. DC Power Distribution for Data Centers

In the power-chain efficiency calculator multiply UPS, transformer/PDU, distribution and PSU efficiencies at the actual load fraction rather than nameplate, and offer architecture presets for the five options with Table 1 values as defaults.

  • The paper calls the North American 480 V AC system with PDU transformers inefficient and obsolete for new designs.
Research paperPDF

Technology Review for Carbon Neutrality (Tsinghua University Press) 2025

Accelerating liquid cooling adoption in data centers: necessity, challenges and solutions

For racks where GPU/accelerator thermal design power exceeds 1,200 W, take liquid cooling as a mandatory design input, and weigh the initial cost (about 1.9-2.2 times air cooling) against TCO (up to 20% lower after 4 years, vendor figure).

  • Cooling systems in air-cooled data centres consume around 40% of total data-centre energy.
Research paperPDF

Applied Energy (Elsevier BV) 2025

Accounting carbon emissions from electricity generation: a review and comparison of emission factor-based methods

In data-centre carbon accounting, state the method (Tier 1, 2, 3) and factor source (IPCC or national) when choosing a grid emission factor; simple methods can underestimate generation emissions by about 73%.

  • AEF for the North zone by Method 5 rose from 0.1627 tCO2/MWh in 2016 to 0.4709 in 2022, then fell to 0.3936 in 2023.
Research paperPDF

Energies (MDPI AG) 2018

Analysis of Air-Side Economizers in Terms of Cooling-Energy Performance in a Data Center Considering Exhaust Air Recirculation

In airside economiser design, plan exhaust grilles and the building envelope so recirculation stays below 5%; 15% recirculation raised energy about 6.1% for direct and 9% for indirect.

  • The authors recommend placing exhaust-air grilles so recirculation is below 5%, or handling it in the envelope plan at design stage.
RegulationPDF

European Commission 2026

Annexes 1 to 3 to Commission Delegated Regulation C(2026) 3472 - EU data centre energy (PUE) and water (WUE) efficiency classes, data centre label, and amendments to Delegated Regulation (EU) 2024/1364

Translate PUE and WUE targets into A-G classes: class A needs a design PUE of 1.15 or below and WUE of 0.1 or below; the class D boundary is 1.5 and 0.6. Write the class target into the design specification.

  • WUE classes: A <= 0.1; B 0.1-0.2; C 0.2-0.4; D 0.4-0.6; E 0.6-0.8; F 0.8-1.0; G > 1.0.
Research paperPDF

arXiv preprint (cs.AI), Harvard T.H. Chan School of Public Health 2026

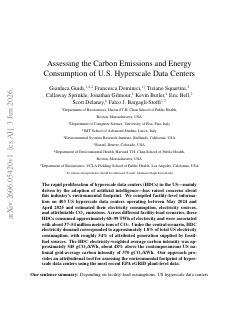
Assessing the Carbon Emissions and Energy Consumption of U.S. Hyperscale Data Centers

In fleet or facility energy estimation, use capacity × 8,760 × facility-load coefficient (0.48-0.70, central 0.58) and report the range (67.7-98.6 TWh) explicitly.

  • State-level intensities (central scenario): Virginia 535, Oregon 440, Iowa 645, Nebraska 740, Wyoming 1035 gCO2/kWh; Virginia had 142 HDCs, 21.0 TWh, 11.5 Mt.
Research paperPDF

arXiv preprint (cs.SE), Google 2024

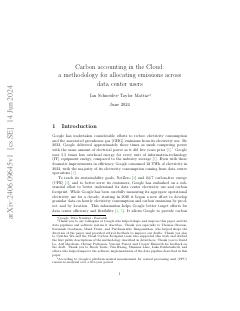
Carbon accounting in the Cloud: a methodology for allocating emissions across data center users

In allocating carbon to data-centre users, give idle power to whoever holds the resource allocation and share dynamic power by actual usage; because an idle server draws about 45% of peak power, the idle share is large.

  • Resources with equivalent busy power used to weight idle-power allocation: 1 Intel Skylake N1 CPU core = 20 GiB RAM = 1 TiB SSD = 6 TiB HDD.
Research paperFree to read

Proceedings of the 28th ACM International Conference on Architectural Support for Programming Languages and Operating Systems, Volume 2 (ACM) 2023

Carbon Explorer: A Holistic Framework for Designing Carbon Aware Datacenters

Add an hourly 24/7 CFE coverage calculator to site and energy design that sizes wind, solar, BESS (in hours of IT load) and server headroom together; use hourly or sub-hourly supply profiles, never daily averages.

  • Grid lifecycle intensities (gCO2eq/kWh): wind 11, nuclear 12, hydro 24, solar 41, biofuels/other 230, natural gas 490, oil 650, coal 820.

All content and rights belong to the respective authors and publishers. SoSo CAD provides only the citation, its own summary and a link to the source, and is not responsible for the sources' content.

Monthly newsletter · free

Keep your reading list current

Once a month: new library sources, changes to Turkish regulations and upcoming data centre events.