Voltage-selection rule: motors above about 200 kW (large chillers and pumps) default to MV (4.16/6.6/11 kV) feeders; compute I = P/(sqrt(3) x V x PF) to show cable savings.
1,500 HP pump: 1,420 A at 480 V vs 164 A at 4.16 kV
Use it for historical context on PUE: knowing that 2.0 was the 2007 average starting point, compare your current target PUE values against that reference.
Data center peak grid load was about 7 GW (about 15 baseload power plants), expected to reach 12 GW by 2011.
Reference the specification in a cold plate purchase requirement and state which tests, limits and sampling the customer requires, since many limits are examples.
Flow rate testing goes up to velocities below 1.5 m/s to ensure no erosion or leaks.
Use the 13 methods to seed the cooling-plant catalogue enum (dx_air, dx_glycol, dx_water, chw_crah, pumped_refrigerant, self_contained, rooftop, direct_fresh_air_evap, indirect_air_economizer)
13 basic heat-removal methods are identified; 11 rely on the refrigeration cycle as the primary means
Place a dry stage upstream of the tower and size it against the share of hours where warm return water exceeds dry-bulb temperature by enough margin, as the 9.4 °C transition point does here.
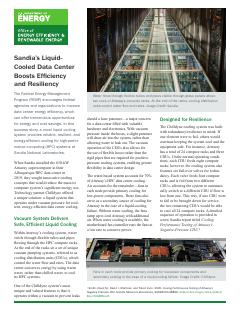
Building heat reuse peaks at 0.434 MW of a 0.910 MW load, leaving 0.496 MW to reject to atmosphere.
Check whether the warm return water from liquid cooling (here 84 °F after energy recovery) leaves enough temperature difference to ambient for a dry or hybrid stage, and size it against local dry-bulb hours.
First-year heat rejection: 10.5% building heat reuse, 42.5% thermosyphon and 47% cooling towers.
Build an operational-readiness score in the operations module: staffing model (24x7 on-site for Tier III/IV intent), maintenance programme (PM schedule, CMMS), training/qualification and procedures (MOP/SOP/EOP)
Calculate availability from MTBF and MTTR before choosing a UPS configuration; apply the same method to single-unit, N+1 and dual-redundant layouts to compare the gain from redundancy with the cost of the added components.
C4ISR facilities require a reliability level of 99.9999 percent (the six-nine rule), which may call for greater redundancy.
When writing an availability target into a data centre specification, state the measurement interval as well; the same downtime gives 95.83 or 99.86 percent depending on the interval.
With exponentially distributed failures, reliability at an operating time equal to the MTBF is only about 37 percent (e^-1 = 0.368).
At design stage carry out an FMEA for each critical system and record failure modes, effects and detection methods as input to the RCM decision logic; the text stresses that RCM starts in design and continues for the life of the facility.
For an exponential failure distribution with constant failure rate, an item with a 1000-hour MTBF has only a 37 percent probability of surviving 1000 hours of continuous operation.
Draw the UPS, generator and chiller chain as a series-parallel block diagram and compute system reliability on paper first, with the product rule for series parts and the parallel formula for redundant ones.
Series system reliability is the product of element reliabilities: R = R1 x R2 x R3.
At design stage run a functional FMEA of each critical system (power, generators, cooling); do not start without schematics, bill of materials, block diagram and the mission requirement.
The Risk Priority Number is Severity (1-10) x Occurrence (1-10), optionally multiplied by Detection: RPN = S x O x D.
All content and rights belong to the respective authors and publishers. SoSo CAD provides only the citation, its own summary and a link to the source, and is not responsible for the sources' content.